May 19th Daily Analysis
May 19th Daily Analysis

U.S. DOLLAR INDEX (USDX)
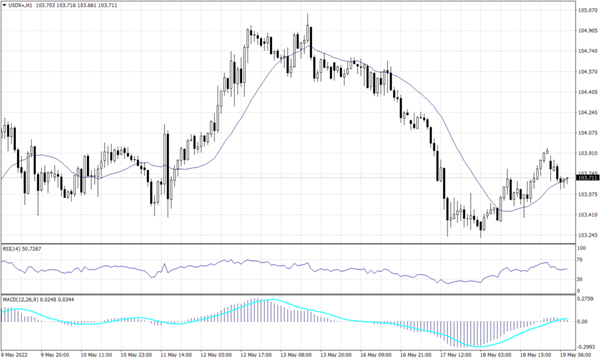
The U.S. Dollar Index started the fourth declining day in what is seen as a corrective movement trading around the support of 103.60. The long term remains positive above the 20-day moving average on the daily chart.
On the daily chart, the index shows a slight possibility for a continuation of the uptrend. However, the hourly chart shows support around the current levels between 103.40 and 103.60.
PIVOT POINT: 103.60

EURO (EURUSD)
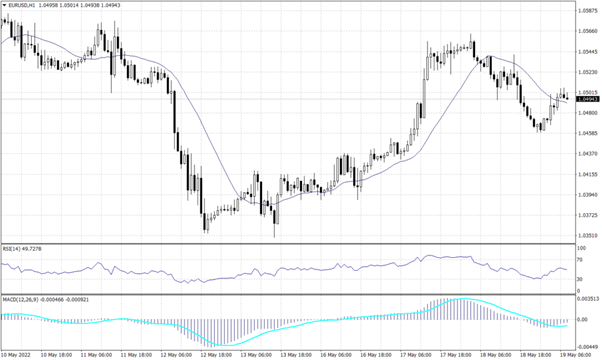
The common currency remains in a downwards trend over the daily time frame, even with the gains recorded over the last several days. The EURUSD touched resistance at 1.0540 before showing a tendency to trade lower.
Technical indicators show a higher possibility to fall than continuing the uptrend, however, the moving average on the daily chart remains above the current price levels.
PIVOT POINT: 1.0490

STERLING POUNDS (GBPUSD)
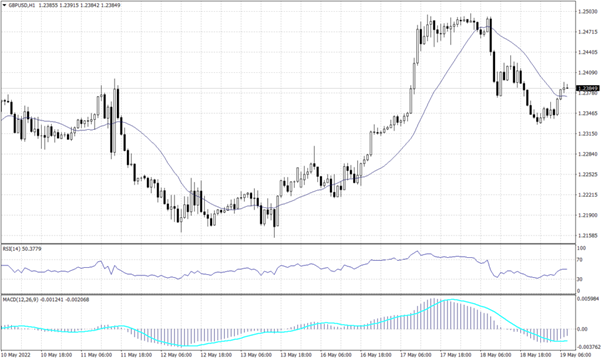
The Sterling pound traded horizontally this morning and built a neutral level. However, the chart shows a reversal pattern on the hourly chart while it signals a continuation of the long-term negative trend on the daily chart.
The RSI and MACD are showing signals for a further decline, while price action retains the reading of 1.2100 during the day.
PIVOT POINT: 1.2300

JAPANESE YEN (USDJPY)
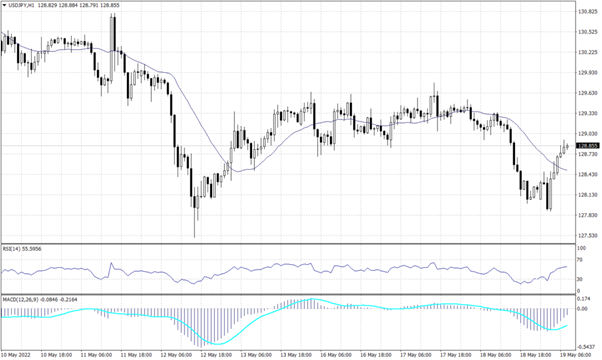
The USDJPY pair traded below the support of 130.30 for the fourth consecutive day and formed a declining pattern on the hourly chart. Meanwhile, the pair remains in the uptrend on the daily chart unless it broke below the support of 128.70. While the moving average reading indicates that the current level is critical resistance, MACD and RSI readings are neutral.
PIVOT POINT: 128.70

SPOT GOLD (XAUUSD)
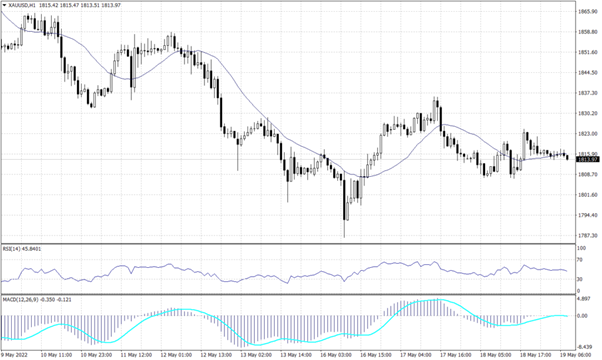
The precious metal traded flat during the early sessions at around 1,810. The gold trend line on the hourly chart shows a neutral direction without clear signals. However, the chart remains negative on the daily time frame while solidifying the support at 1,810.
Meanwhile, technical indicators are neutral and do not show direction.
PIVOT POINT: 1,810

WEST TEXAS CRUDE (USOUSD)
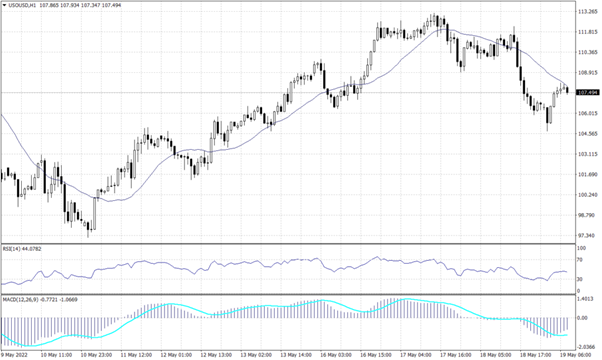
Crude oil is trading on an uptrend hovering above 110 for the third day amid supply worries. Meanwhile, on the hourly chart, the crude shows support at $107.10 and resistance below $111.30.
Due to the heavy buying pressure, technical indicators show a possibility to see crude oil lower at $107. However, price action and moving average show a higher probability of continuing climbing.
PIVOT POINT: 107.50