April 11th Daily Analysis
April 11th Daily Analysis

EURUSD
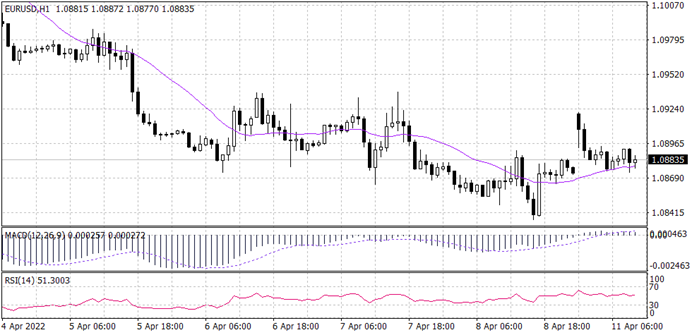
The long-term trend for EURUSD looks bearish. On the 1-hour time frame, the price seems to be making a series of lower lows, indicating a further decline. Price is currently trading below the 20 period MA at the level of 1.0895. The RSI and MACD both show that the price is most likely targeting 1.0640 in the long run.
PIVOT POINT: 1.0895

Ethereum (ETHUSD)
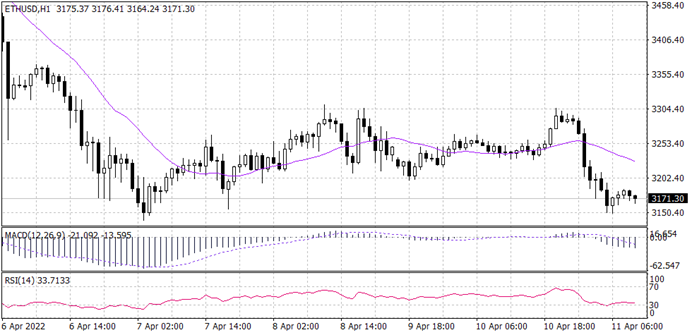
The ETHUSD price trend on the daily time frame is bullish. However, in the hourly time frame, the price has been making sharply lower lows ending near 3,150. The price is likely to make a pullback to the level 3,210 which is in intersection with the 20 period MA and the Fibonacci level of 38.2 and 50. In technical indicators, the RSI shows that ETHUSD is oversold which may lead to a possible reversal of price to the upside.
PIVOT POINT: 3,160

GBPUSD
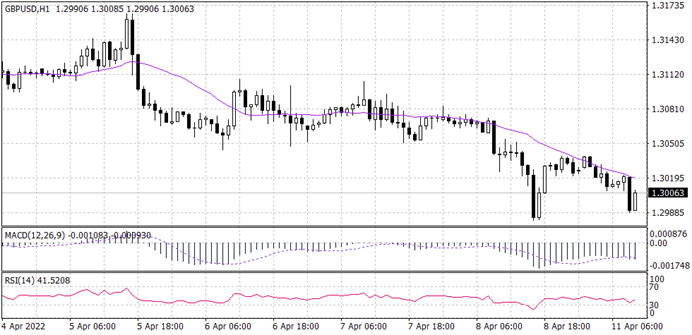
The overall trend for the GBPUSD from the daily time frame looks bearish. Similarly, the hourly time frame shows the price moving to lower lows. Price is trading below the 20-period moving average, while the RSI and MACD both show that the price is in a continuous trend to the downside.
PIVOT POINT: 1.3020

Spot Gold (XAUUSD)
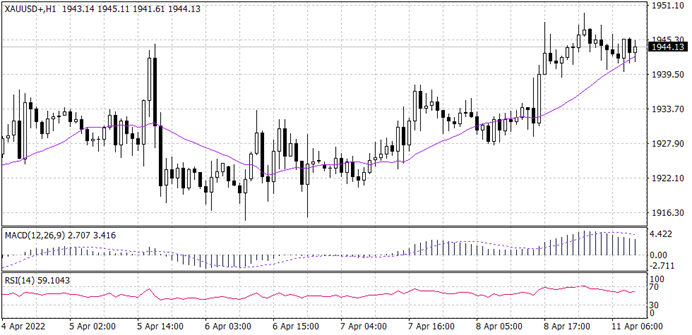
GOLD SPOT price has been moving horizontally from the daily time frame. Furthermore, in the hourly time frame price is also moving horizontally. The breakout from the horizontal movement of price will give Gold Spot a significant direction. The RSI and MACD are moving within the centre-line which indicates a horizontal movement of price.
PIVOT POINT: 1,940
S&P 500 (SPX500)
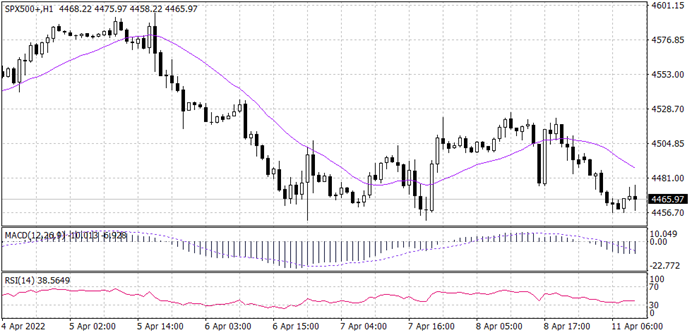
The overall trend for SPX500 looks bullish. However, from the hourly time frame price has been moving to the downside. Price is currently at a level of 4,458 which could lead to a possible pullback to the 20 period MA before continuing to the downside. The RSI and MACD technical indicators both show price continuation to the downside.
PIVOT POINT: 4,458