October 10th Daily Analysis
October 10th Daily Analysis

U.S. DOLLAR INDEX (USDX)

The dollar held its ground as investors set their sights on data later in the week. Traders expect the data to show red-hot inflation after a strong U.S. labor market reinforced bets on higher interest rates.
U.S. unemployment unexpectedly fell last month and inflation data due on Thursday is expected to show headline inflation at a hot 8.1% year-on-year. Policymakers’ preferred core inflation is seen rising to 6.5%.
Technically:
The index remains positive on both the daily and hourly charts after the correction. The hourly chart is bouncing after the correction hit 111.00. Meanwhile, the daily chart shows strong resistance between 112.30 and 112.80. On the other hand, technical indicators show a possible continuation of the uptrend on MACD figures and a horizontal trend signal on the RSI on the daily chart.
Pivot Point: 112.75

EURO (EURUSD)
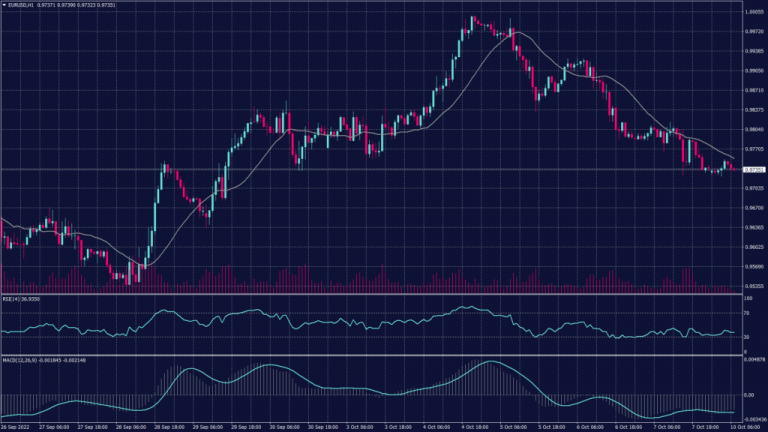
Climbing oil prices and geopolitical tension also provided plenty of reasons for nervousness about growth, weighing on energy-importer currencies in Europe. EURUSD was down 0.45% at $0.9938 while it remains negative on the daily chart as long as it trades below the parity levels.
Pivot Point: 0.9720

SPOT GOLD (XAUUSD)
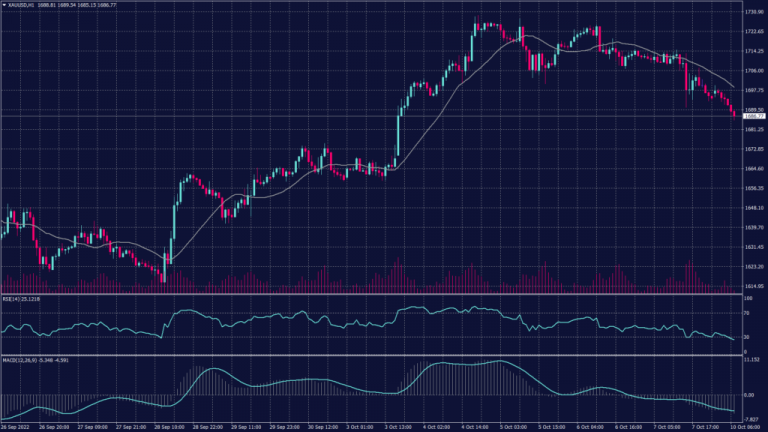
Gold prices stayed below key levels on Monday after a strong U.S. jobs report gave the Federal Reserve few reasons to soften its hawkish rhetoric, while concerns over geopolitical instability in Europe and Asia fed safe haven trades into the dollar. Metal markets slid on Friday after U.S. labor department data showed nonfarm payrolls rose more than expected in September, while unemployment also fell from August.
Spot gold rose 0.2% to $1,698.07 an ounce after slipping below the key $1,700 level on Friday. Gold futures fell 0.2% to $1,705.40 an ounce.
Pivot Point: 1,685

WEST TEXAS CRUDE (USOUSD)

Oil fell on Monday as an unexpected contraction in China’s service sector fueled fears of slowing demand, although an OPEC supply cut and the prospect of more disruptions in Russia kept prices pinned near a one-month high. Brent futures fell 0.7% to $97.73 a barrel, while WTI futures fell 0.2% to $92.42 a barrel. Both contracts rallied over 10% last week to a one-month high after the OPEC+ announced their biggest supply cut since the 2020 COVID-19 pandemic.
WTI spot contracts remain inside the declining daily channel despite reaching the highest level since mid-September. To break into the uptrend, WTI prices should close the day near $91.35 a barrel. However, the 14-day RSI shows a slowdown in the momentum and a possibility of a continuation to the downside. Meanwhile, the MACD readings show a horizontal trading pattern.
On the hourly chart, technical indicators are peaking and are signalling a possible turn to the downside. However, moving averages 20 and 50 are still supporting the uptrend.
Pivot Point: 91.50