June 3rd Daily Analysis
June 3rd Daily Analysis

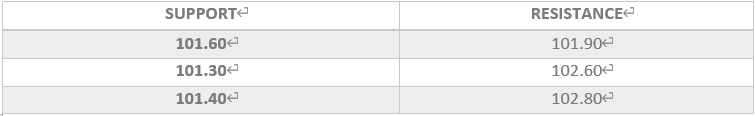
U.S. DOLLAR INDEX (USDX)
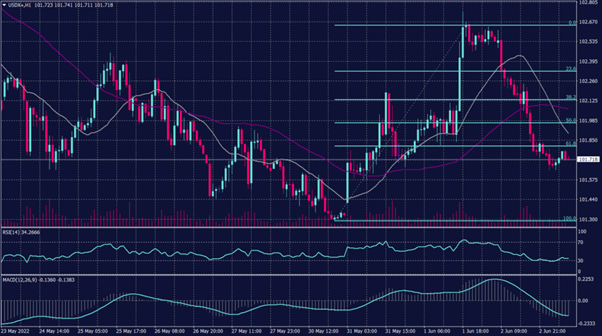
Market participants focus on the upcoming U.S. labor data that is due on Friday, which is considered crucial for the Fed rate anticipations. The upcoming employment report is likely to show the tight labor market, to shift to more modest payroll growth.
The Non-farm figures are likely to increase by about 325,000, 103,000 less than the previous month. While still strong, the projected advance would be the smallest in over a year. In the meantime, the unemployment rate is seen falling to a pandemic low of 3.5%, and average hourly earnings are forecast to rise 0.4% from a month earlier.
Technically:
The U.S. dollar index fluctuated between the resistance of 102.60 and the support of 101.60. Meanwhile, on the daily chart, the USDX is trying to break away from the declining trendline, but it remains bearish for the time being.
On the hourly chart, 20 SMA and 55 SMA intersect, and both are above the current price range which signals a slight fluctuation on the way down.
PIVOT POINT: 101.70
EURO (EURUSD)
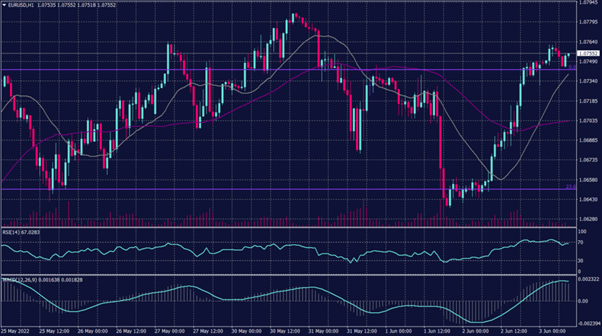
The Euro posted gains as the greenback weakened yesterday, but the pair remained stable during the early trades.
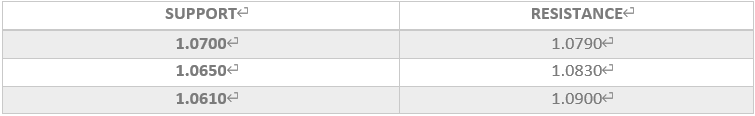
However, Fibonacci retracement shows resistance1.0750 while technical indicators show a possibility of a decline. Though, moving averages show a change in direction and set a target at 1.0700.
PIVOT POINT: 1.0750
STERLING POUNDS (GBPUSD)

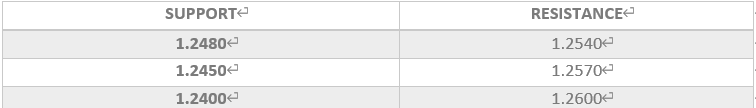
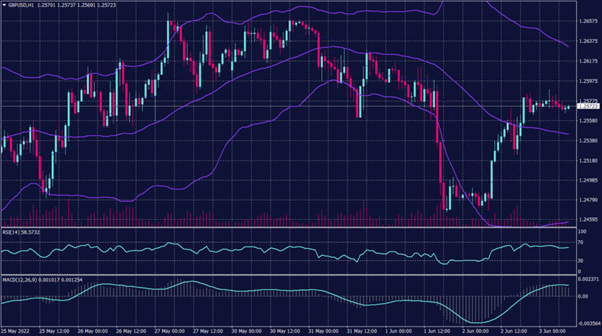
The Sterling traded steadily near 1.2780 and is trading above the intersection of the 20 SMA and 55 SMA which signals a decline towards 1.2540. In the meantime, on the Daily chart, the pair is set for a decline in the longer time frame and remains near the daily resistance of 1.2540.
PIVOT POINT: 1.2500
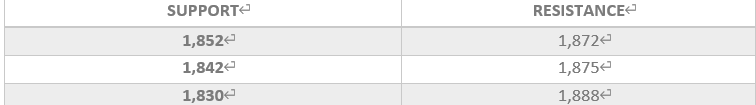
SPOT GOLD (XAUUSD)
Gold jumped yesterday reaching above 1,870 and it started to retreat during today’s early trades. Gold prices are set for a decline towards 1,815 on the daily chart. Meanwhile, in the hourly chart, spot gold penetrated out of the regression channel, but it remains set to decline.
On the daily chart, the precious metal returns to its primary decline trend targeting the resistance at 1,810 and 1,790. However, spot gold shows a change in direction and signals further decline below the support at 1,842 during the day.
PIVOT POINT: 1,866