October 17th Daily Analysis
October 17th Daily Analysis

U.S. DOLLAR INDEX (USDX)

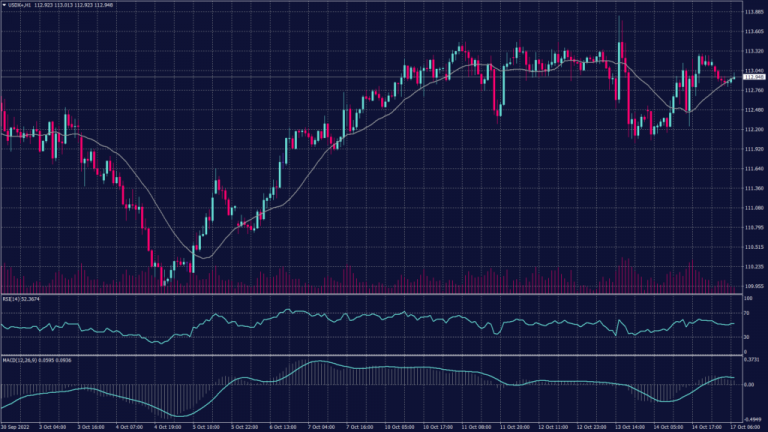
The U.S. dollar started a slow-paced week as the dollar index traded slightly below 113 during the Asian session. However, this week is expected to be calm with the absence of major news. The index fell from the resistance levels at 113.25 towards the key support at 112.40 which is expected to grant momentum for a rebound.
However, we still expect two scenarios at this stage. The first one, if the index broke above 113.25 it will probably head towards 114 and 114.30. on the other hand, if the index failed to penetrate the resistance, it might head towards 112 in the short run. However, the daily chart remains positive as long as the index is trading above 109.60.
Pivot Point: 112.90

STERLING POUND (GBPUSD)

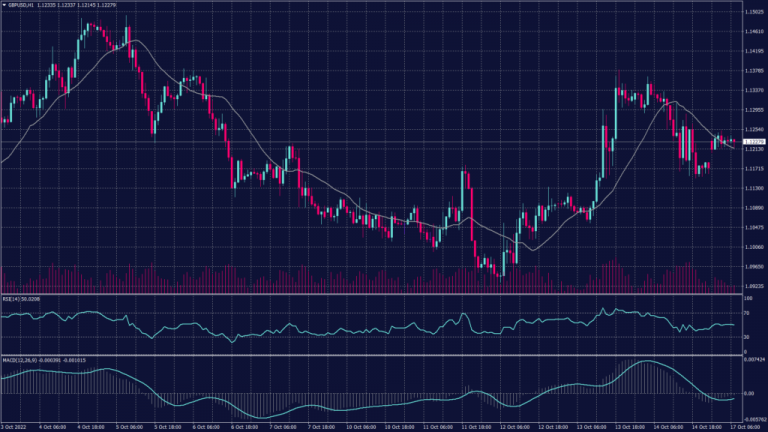
Sterling Pound edged higher on Monday following British Prime Minister Liz Truss’s partial reversal of her government’s economic plan. The pound gained 0.6% to $1.1245 in early Asia trade, after Truss said on Friday that Britain’s corporation tax will rise to 25% from April next year instead of keeping it at 19% as part of her government’s initial “mini-budget”. The Bank of England has had to step in to restore calm, announcing an emergency bond-buying program but is also adamant it will end the program on Friday.
The pound remains inside the negatively trending channel despite the fluctuations around 1.1250. The hourly chart shows support at 1.1200 while the gap between 1.1180 and 1.1210 indicates weak momentum. On the other hand, the daily chart shows a continuation to the downtrend towards 1.0440
PIVOT POINT: 1.1265

SPOT GOLD (XAUUSD)

Gold prices inched higher on Monday but were pinned below key support levels as markets feared more interest rate hikes by the Federal Reserve.
The yellow metal marked its worst week in two months as data showed U.S. inflation will likely take much longer to cool than initially expected. The reading drove up expectations of more inflation-busting rate hikes when the Fed meets in November. Spot gold rose 0.1% to $1,646.02 an ounce, while gold futures rose 0.2% to $1,651.35 an ounce.
Gold prices are heading downwards on the hourly chart reaching the support at $1,665 per ounce. However, the current support is not strong enough to hold against the current selling pressure which might break the supports at 1,665 and 1,659 to head towards 1,650.
Meanwhile, the daily chart remains within the downtrend channel heading towards 1,620 on the foreseen time frame.
Pivot Point: 1,655

WEST TEXAS CRUDE (USOUSD)

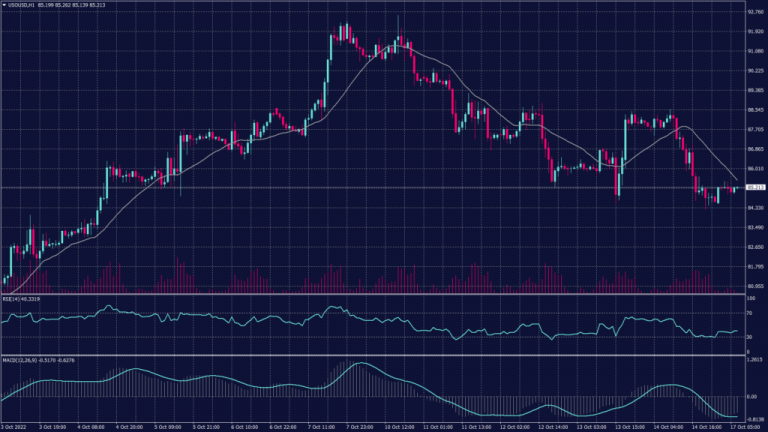
Oil prices rose in thin trade in early Asian hours on Monday as the U.S. dollar’s strength eased while investors awaited data from China to gauge demand at the world’s top crude oil importer. Brent futures rose 0.9% to $92.48 a barrel. WTI crude was at $86.34 a barrel, up 0.9% after a 7.6% decline last week.
The WTI chart shows a downward trend on the daily chart while trading right above the support at 86.60. However, the technical indicators show a chance of fluctuations between 85.60 and 87.40 before deciding the actual trend.
The hourly chart on the other hand is moving below the 20 and 50 periods moving average which indicates a high possibility of a negative trend continuation.
PIVOT POINT: 85.30
