January 09th Daily Analysis
January 09th Daily Analysis

U.S. DOLLAR INDEX (USDX)

The U.S. Dollar further declined this morning as markets discount the recent economic data in addition to the expectations of upcoming CPI data. Data on Friday showed U.S. nonfarm payrolls rose by 223,000 jobs in December, while a 0.3% rise in average earnings was smaller than expected and less than the previous month’s 0.4%.
Investors have pinned their hopes on the Fed to ease its monetary policy. Fed fund futures now imply around a 25% chance of a half-point hike in February, down from around 50% a month ago. With the next Fed meeting scheduled at the start of next month, investors will focus on the consumer price index data due on Thursday.
The dollar index trades under heavy selling pressure and remains committed to the downtrend that started in early November. However, the daily chart shows support at the current levels between 103.00 and 103.30 while 20 day moving average signals further decline. Meanwhile, the hourly chart shows robust selling pressure despite the overselling readings from RSI and MACD.
Pivot Point: 103.30

CHINESE YUAN (USDCNH)

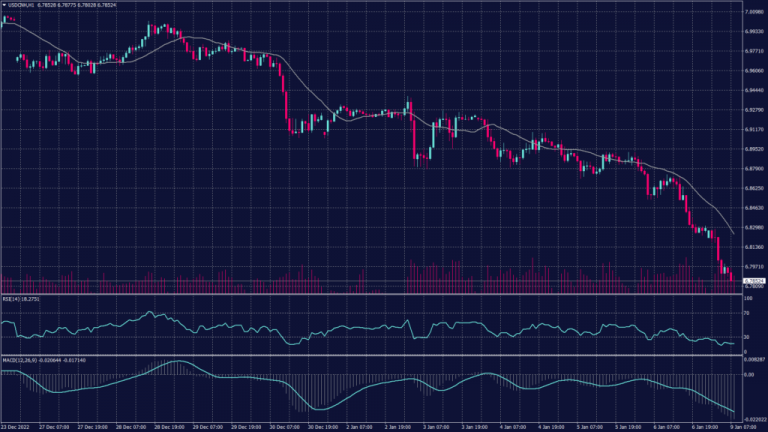
Chinese yuan hit a four-month high after the country reopened its international borders, while hopes of a less hawkish rhetoric from the Federal Reserve also weighed on the dollar and supported regional units. The yuan jumped 0.7% to 6.7912 against the dollar to record its strongest level since late August.
The pair trades in a downtrend on both the hourly and daily chart while the moving average indicates a continuation of the downtrend. Technical indicators signal an increased selling pressure.
Pivot Point: 6.7850

SPOT GOLD (XAUUSD)

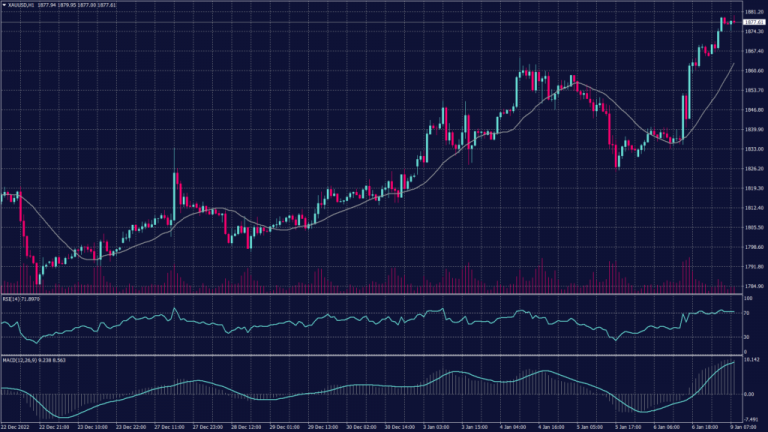
Gold spot prices rose to $1,880 per ounce, sticking to a seven-month high after signs of a cooling jobs market pushed up expectations for a softer U.S. inflation reading this week and an eventual turn in the Federal Reserve’s hawkish policy.
Prices of the yellow metal surged on Friday after data from the Labour Department showed U.S. nonfarm payrolls grew at their slowest pace in a year in December. Readings for the previous two months were revised lower, while wage growth also eased.
Focus now turns to U.S. CPI data due on Thursday for more cues on the path of U.S. interest rates. The CPI report is expected to decline to a one-year low in December, indicating that a series of sharp interest rate hikes by the Fed in 2022 are having their intended effect. The Fed is now expected to further slow its pace of interest rate hikes, with a majority of traders pricing only a 25 basis point hike in February.
Spot gold remains solid and hits the strong resistance at 1,880 this morning while keeping the buying pressure at the highest levels in a few months. If gold prices broke above 1,880 it is likely to see 1,900 and 1,910. However, if gold failed to break the resistance it will most likely drop between 1,860 and 1,850.
Pivot Point: 1,875

WTI FUTURES (CL-OIL)

Oil prices rose this morning, recovering a measure of recent losses as investors bet that an economic reopening in China and a less hawkish path from the Federal Reserve will help spur a recovery in crude demand this year.
Oil markets are betting that this reopening will spur a sharp recovery in demand, as more portions of the world’s largest crude importer spring back into pre-pandemic levels of production. Some analysts forecast that crude prices could surge to as high as $140 a barrel this year on a recovery in Chinese demand. Brent oil futures rose 0.8% to $79.23 a barrel, while West Texas Intermediate crude futures grew 0.7% to $74.31 a barrel.
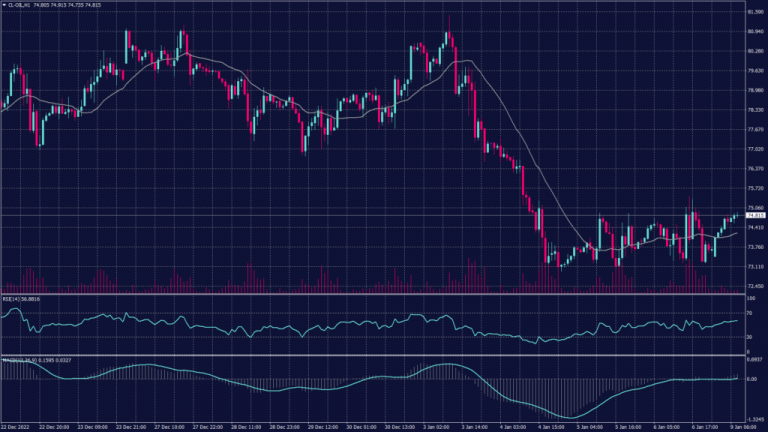
On the hourly chart, the WTI chart moves in a wide horizontal range between 73.60 and 75.00 while staying inside the declining channel on the daily chart. Technical indicators stand neutral and moving averages signal a slight advancement from the current prices to $75.
Pivot Point: 74.70
