Mar 7th Daily Analysis
Mar 7th Daily Analysis

GBPCHF

Technical analysis:
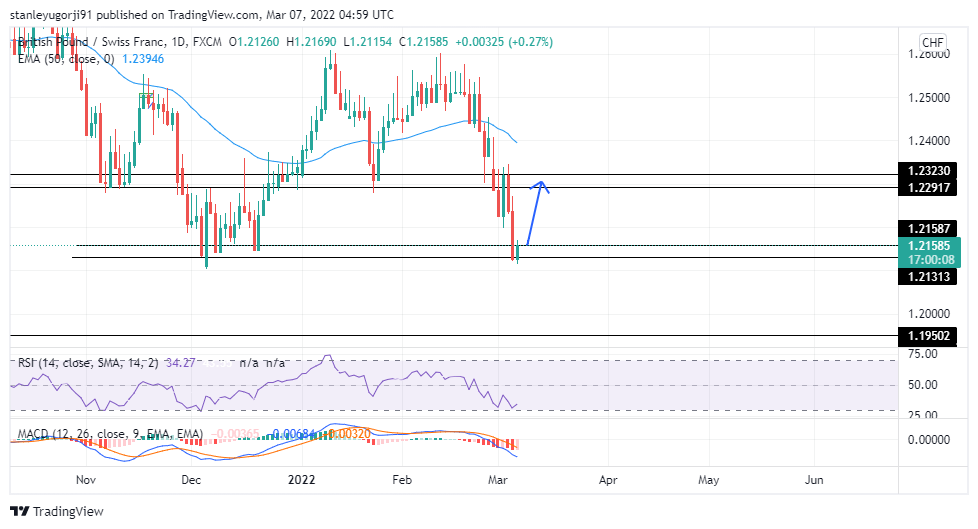
From the overview of price we could see that the overall trend is bearish. Price seems to be reacting to the resistance zone between 1.21587 and 1.21313 and may possibly make a reversal to the support zone between 1.22230 and 1.22917. There could be a possible retest of the 50 EMA for confluence. The RSI is already oversold for a possible reversal.
UK100GBP

Global market sentiment was smashed this past week as Russia’s attack on Ukraine stretched beyond the first week. European markets were left particularly vulnerable. It was the worst week for Germany’s DAX 40 index since March 2020, falling over 10%. This is as the United Kingdom’s FTSE 100 index sank 7.6%, the most in two years.
Technical analysis:
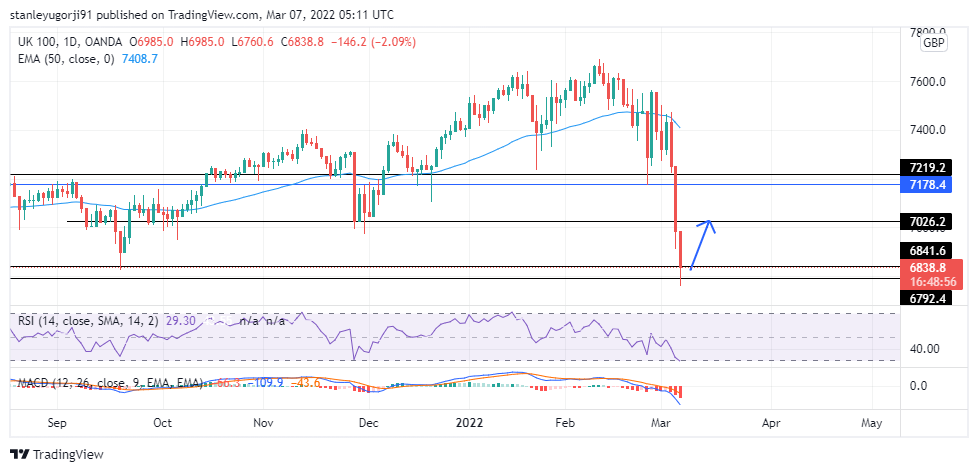
The overview of price shows that market has been in an overall downtrend. Price is currently reacting to the resistance zone between 6833.4 and 6792.4 and may likely make a pullback to the support zone between 7013.9 and 6968.8. We could see that the RSI is oversold.
SUGARUSD

Indian sugar exports could touch a record high of 7.5 million tonnes (MT) in the current marketing year 2021-22 as against the estimated 6 MT. However, traders and exporters do not expect substantial increase in domestic sugar prices.
A rise in the amount of sugar diverted to ethanol production has led to a deficit globally which Indian exports are filling.
Technical analysis:
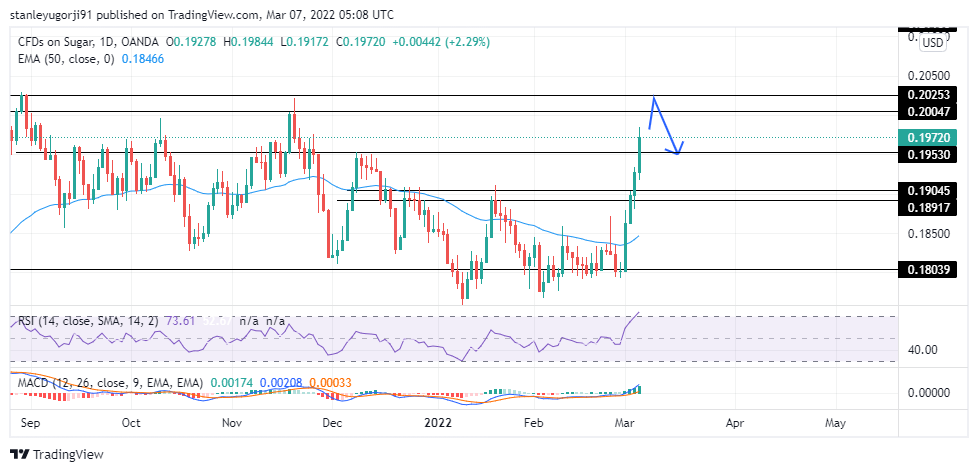
From the overview of price we could see that the overall trend for sugar is to the upside. Price has clearly broken series of highs and is expected to reach the resistance zone between 0.20253 and 0.20047 before making a possible pullback to the support level around 0.19530. We could see that the RSI is in the overbought level.