January 06th Daily Analysis
January 06th Daily Analysis

U.S. DOLLAR INDEX (USDX)

The U.S. dollar traded near a one-month high this morning after U.S. economic data showed that the labor market could keep the Federal Reserve on its aggressive rate hike path. The number of Americans filing new claims for jobless benefits dropped to a three-month low last week while layoffs fell 43% in December, data on Thursday showed.
Investors now focus on the nonfarm payroll report to get a better idea about the labor market. Market participants expect the economy to add 200K jobs in December which is 63K lower than the previous reading.
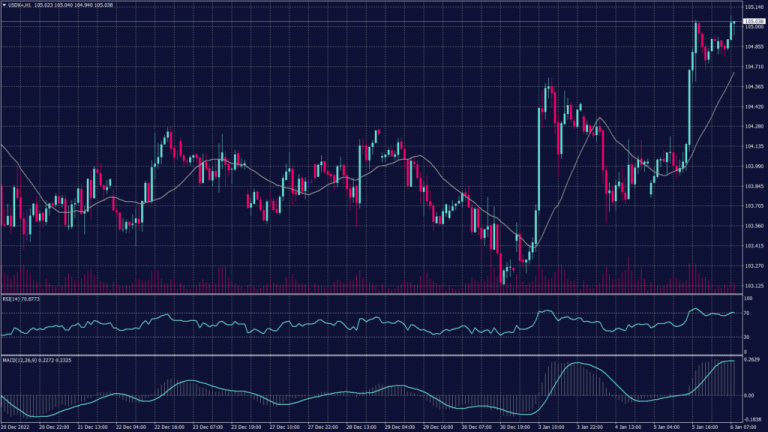
The U.S. dollar index jumped 0.9% to a nearly one-month peak of 105.27 overnight. It was last 0.03% higher at 105.15 and was on track for a weekly gain of more than 1.5%, the largest since September.
Technically, the chart remains committed to the downtrend despite the horizontal fluctuations. 20 periods moving average is still above the current price level and signals further decline. RSI and MACD show an increase in volatility.
Pivot Point: 104.90

EURO (EURUSD)

December’s flash inflation figures for the eurozone are due today where expectations are for an annual inflation rate of 9.7%. Data from Germany, France, and Spain have already shown a slowdown in inflation last month, suggesting that eurozone inflation could come in below expectations.
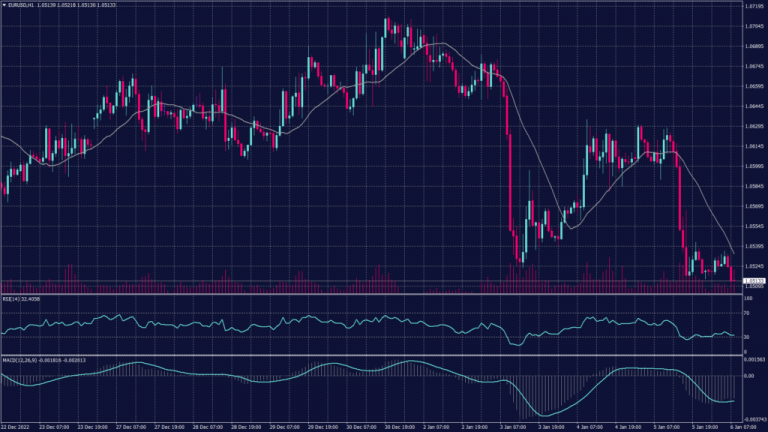
Meanwhile, the euro tumbled 0.8% to a more than three-week low at $1.0515 in the previous session and was last steady at $1.0519.
On the daily chart the pair is showing a reversal pattern with a ceiling set at the resistance of 1.0700. the pattern is expected to head towards 1.0470 before any correction or bounce. However, the hourly chart shows further decline towards 1.0485 and a possible bottom at 1.0470.
Pivot Point: 1.0520

SPOT GOLD (XAUUSD)

Gold traded near seven-month highs during the early sessions as markets await key nonfarm payrolls data. U.S. nonfarm payrolls are expected to decline in December, indicating some slowdown in the labour market after a series of sharp rate hikes by the Federal Reserve in 2022.
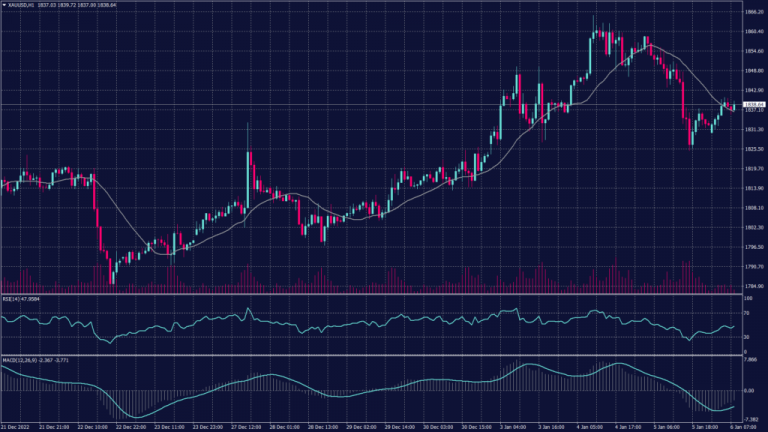
But given that the reading has consistently topped estimates for eight months running, markets fear that any signs of resilience in the jobs market will give the Fed enough headroom for more hawkish moves. Spot gold rose 0.1% to $1,834.53 an ounce, while gold futures fell 0.1% to $1,839.25 an ounce.
Spot gold daily chart shows a continuation of the uptrend while the hourly chart shows fluctuations between 1,840 and 1,850. On the hourly chart, RSI shows overbuying and signals a possibility of a decline to relieve the buying pressure, meanwhile, the MACD intersects with the moving average and signals a divergence and a slight decline.
Pivot Point: 1,850

WTI FUTURES (CL-OIL)

Oil prices gained almost $1 this morning, extending gains from the previous trading session on hopes of a China demand boost and after data showed lower fuel inventories in the United States.
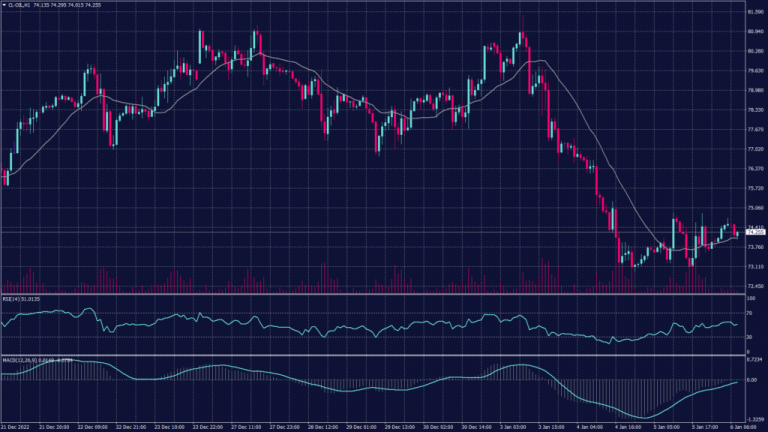
China has abruptly ended its stringent zero-COVID policy, leading to a surge in COVID infections across the country. Meanwhile, U.S. gasoline stocks fell 346,000 barrels last week, according to the EIA data, compared with analysts’ expectations for a 486,000-barrel drop. Brent crude futures were 1.2% higher at $79.63 a barrel while WTI futures were up 1.2% at $74.58 a barrel.
WTI future hourly chart shows high possibility of dropping towards $73.00 per barrel. However, technical indicators remain on the neutral side.
Pivot Point: 73.90
