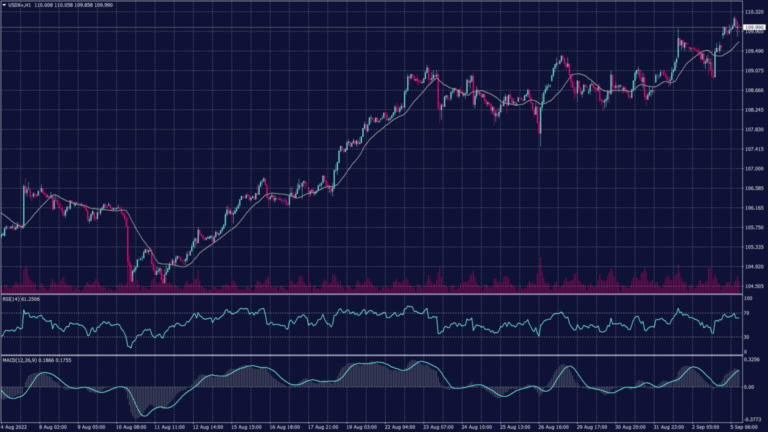
The U.S. dollar rose to a new two-decade high in early European trade before fluctuating lower later in the session. The Dollar Index traded 0.5% higher at 110.255, the highest level in 20 years.
The demand for the U.S. dollar has increased on expectations that the Federal Reserve will continue with its aggressive monetary tightening, especially after the release of the better-than-expected nonfarm payroll data on Friday.
The overall trend remains positive heading to exceeding the current high levels. However, the momentum slowed this morning which might lead prices to decline towards 109.70. Bollinger bands show resistance at 110.40 and possible support at 109.70.
Pivot Point: 109.90
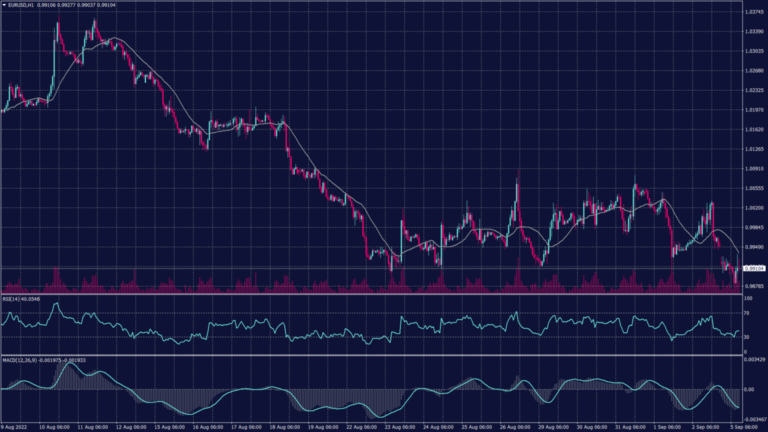
EURO (EURUSD)
The euro fell to 0.9880 dollars for the first time in nearly two decades as Russia’s halt on gas supply down its main pipeline to Europe sparked concerns over energy prices and growth. However, a large hike is being priced into the euro, and it’s debatable how much further the central bank can go with its tightening policy if an energy crisis severely disrupts economic growth in the region.
Technically, the pair remains under selling pressure below the parity levels towards new lows. Technical indicators signal a possibility of further decline towards 0.9810.
Pivot Point: 0.9920
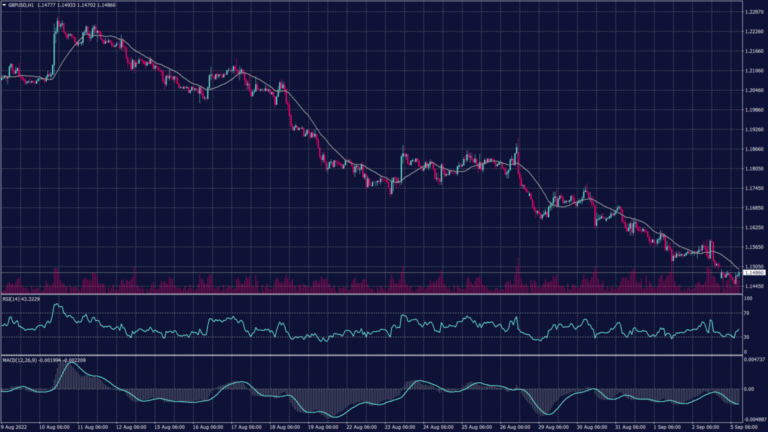
STERLING POUND (GBPUSD)
Sterling plumbed a fresh post-pandemic low on Monday as Russia kept one of its main gas supply routes to Europe shut, adding to recession fears on the day that Britain is set to announce its new prime minister. Considering the cable is one of the worst performing major currencies against the dollar this year, the pound fell as low as $1.1444 to record its weakest level since March 2020.
Pivot Point: 1.1510
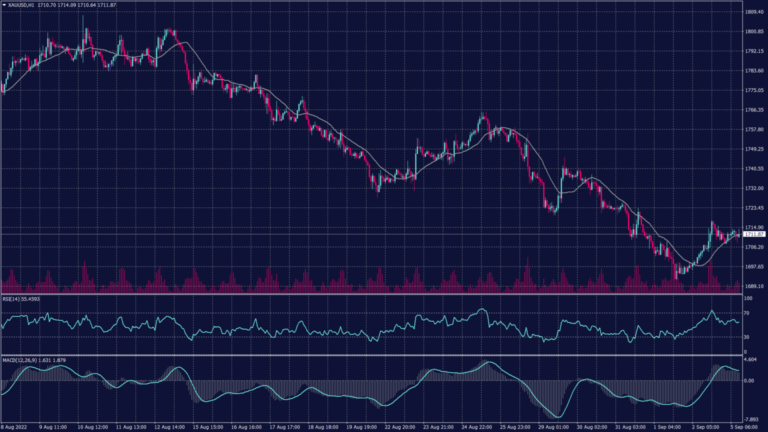
SPOT GOLD (XAUUSD)
Gold prices fell slightly on Monday, extending sharp declines from last week as strength in the dollar and growing uncertainty over hawkish U.S. monetary policy weighed on appetite for the yellow metal. Spot gold fell 0.2% to $1,710 an ounce, while gold futures fell nearly 0.1% to $1,721 an ounce. Both instruments declined dashingly last week on growing worries that the Fed will continue to raise interest rates at a fast pace.
Data on Friday showed that U.S. nonfarm payrolls grew more than expected in August, giving the Fed more space to keep hiking rates sharply. Meanwhile, U.S. wage growth lagged, and unemployment rose, traders are pricing in a 57% chance of a 75 basis point hike at the Fed’s next meeting, seeing sufficient tightness in the labor market.
The yellow metal trend remains negative after finding the resistance between 1,705 and 1,710 on the hourly chart. Technical indicators show a possibility of a horizontal movement between 1,700 and 1,710 before breaking into new short-term lows.
Pivot Point: 1,715
WEST TEXAS CRUDE (USOUSD)
Oil prices jumped over $1 a barrel on Monday, extending gains as investors eyed possible moves by OPEC+ producers to cut output and support prices at a meeting later in the day. Brent crude futures rose 2% to $94.90 a barrel after gaining 0.7% on Friday. Additionally, WTI crude was at $88.60 a barrel, gaining 2% following a 0.3% advance in the previous session.
Technically, WTI prices continue to decline to $86 per barrel after breaking the support at $88.25. technical indicators show the downtrend slowing down without any signs of a rebound.
Pivot Point: 88.90
Start your trading journey with Trade Master today!