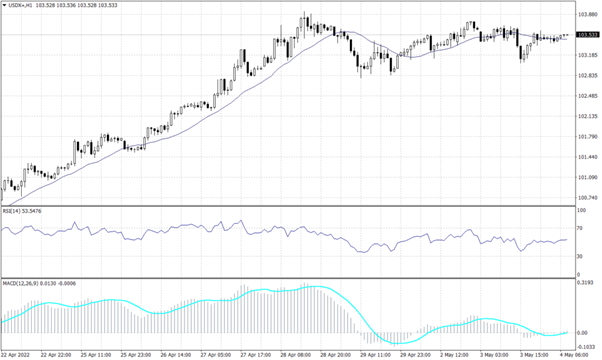
The U.S. dollar failed to hold above 103 after the interest rate hike from the Federal Reserve (Fed) as it matched the expectations. The U.S. Dollar index fall to 102.36 during the early trades and bounced back to 102.73 later. The index declined from a firm resistance at 103.60 which was cemented by the interest rate decision from the Fed. Technically, the index value is expected to decline to 100.50 on the daily chart but the primary trend remains positive unless it broke below 100. However, on the hourly chart, technical indicators and trend lines expect the index to hover above 102 during the day unless broke below 102 so the target will be 101.10. PIVOT POINT: 102.65
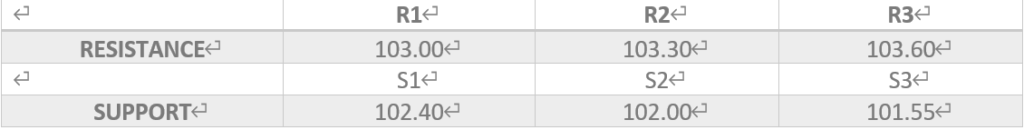
EURO (EURUSD)
The common currency gained ground against the greenback reaching the highest in over a week at 1.0641. Though the pair is unlikely to retain an uptrend, it is expected to hover above 1.0560 during the day. Technical indicators signal a downturn towards 1.0530. Meanwhile, in the longer term, the pair is set to continue its primary downtrend.
PIVOT POINT: 1.0610
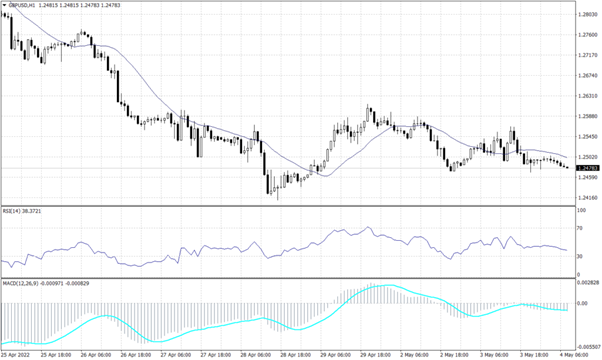
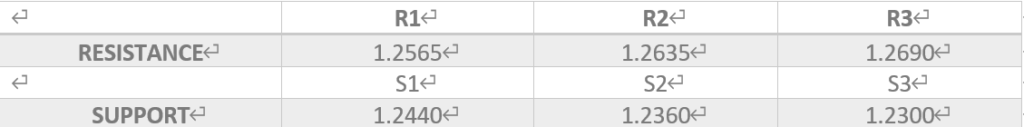
STERLING POUNDS (GBPUSD)
The sterling pound recovered slightly against the dollar reaching its 10 days high at 1.2637, but the cable could not hold its wins and started falling to reach 1.2540. The English currency is pressured by the interest rates decision that is scheduled to be announced later during the day. However, it is expected for the sterling pound to reach the low of 1.2300 before gaining the ability to change the primary downward trend. On the daily chart, the pair is expected to fall back to 1.2410, while the hourly chart shows a likelihood to reach 1.2455. The RSI and MACD are showing signals for a further decline in a slow fashion, while price action retains the reading of a low of 1.2500 during the day and 1.2410 after.
PIVOT POINT: 1.2500
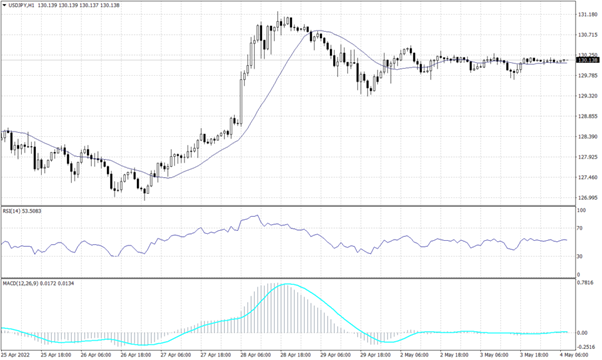
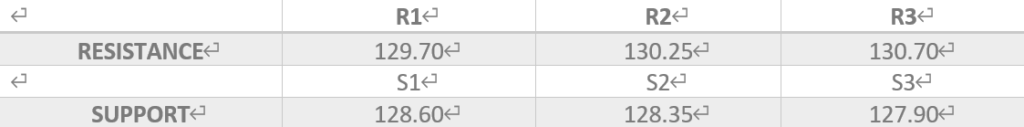
JAPANESE YEN (USDJPY)
The Japanese yen firmed after the Fed statement and the USDJPY pair fall from the resistance at 130 reaching 128.80. The overall trend remains upwards, but the current swing can be a correction movement unless the pair breaks below 126.80 there will be a slight chance to reach 121.60. The pair retains the bullish trend on the hourly chart despite the early fall, the pair is testing the resistance level of 128.60 mentioned yesterday. Technical indicators imply that prices are likely to hover horizontally around the current level for today.
PIVOT POINT: 129.25
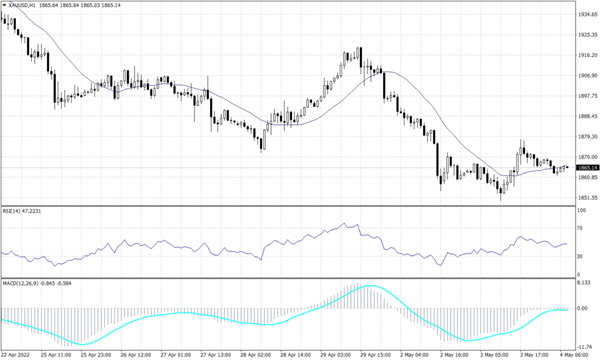
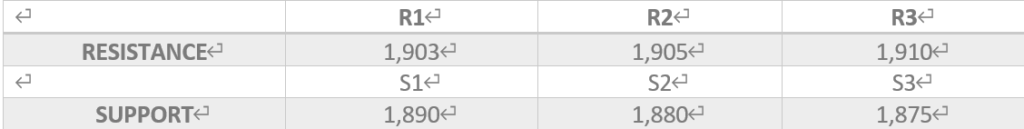
SPOT GOLD (XAUUSD)
The precious metal bounced back from the previously mentioned bottom near 1,855 towards 1,900 opposing the previous readings of the bearish trend. Gold prices retain their negative trend on the daily chart, but it is likely to hover in a range between 1,885 and 1,910 before the continuation of the long-term downward trend. The daily chart shows a continuation of the bearish trend line targeting the range between 1,825 to 1,800. Meanwhile, the hourly chart shows gold in a light volume area, which indicates a turn to 1,890. Furthermore, both the RSI and the MACD imply that the bearish trend will continue. PIVOT POINT: 1,900
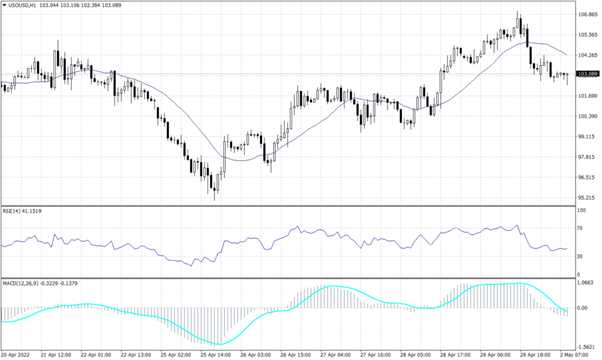
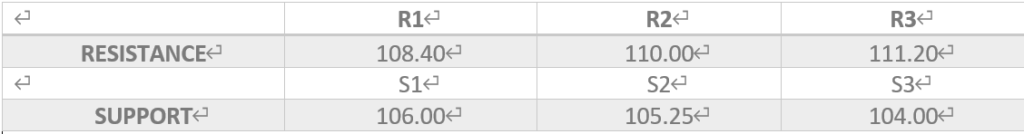
WTI (USOUSD)
The light crude gained $1 this morning after gaining another $4 yesterday. However, the WTI is hovering around $107 during the early trades and indicates a further advance to $110 on the hourly chart and signals support above $106.40. Still, MACD and RSI are opposing the chart readings and show a high possibility to drop towards $105.25 a barrel during the day and target $100 in the longer run. PIVOT POINT: 107.00
Start your trading journey with Trade Master today!