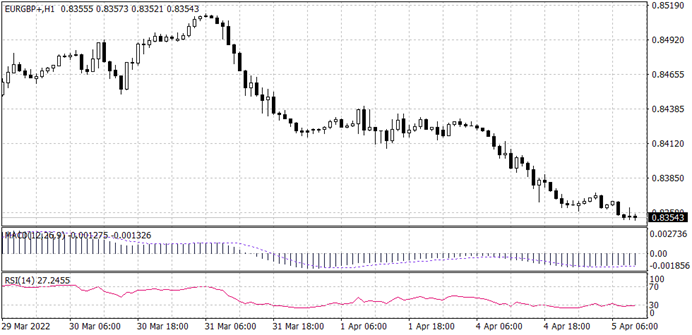
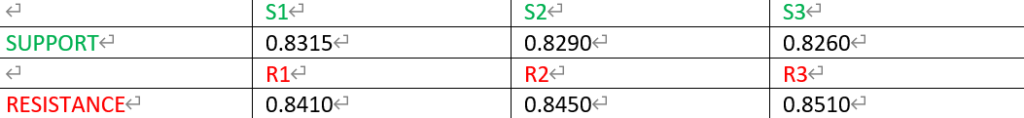
From the daily time frame, the overall trend for price in EURGBP looks bullish. Price currently reacting to a level of 0.8360 which is in confluence with the upward trend-line before a possible move to the bullish direction. Price is also in divergence with the RSI and MACD indicators.
PIVOT POINT: 0.8360
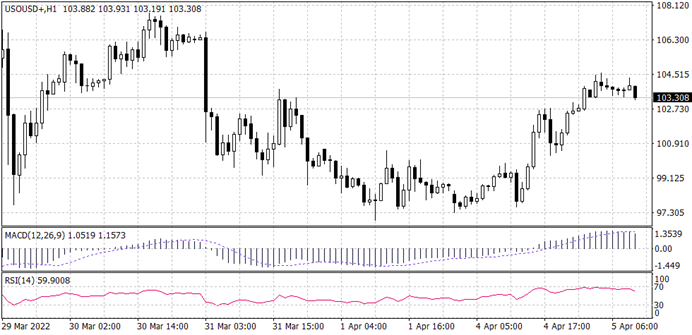
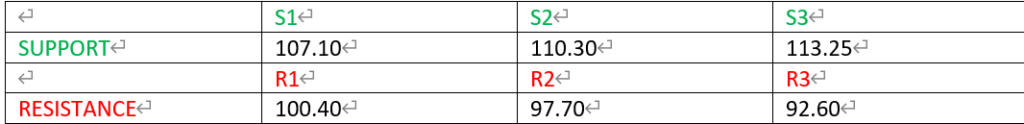
WTI (US OIL)
From the overview of price in WTI, the overall trend is bearish. Price is currently reacting to the resistance level of 103.70 forming a reversal pattern in the form of a rising wedge and in divergence with the RSI indicator for a possible push to the bearish direction.
PIVOT POINT: 103.75
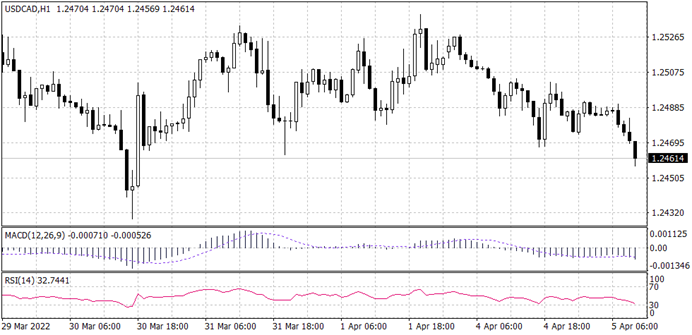
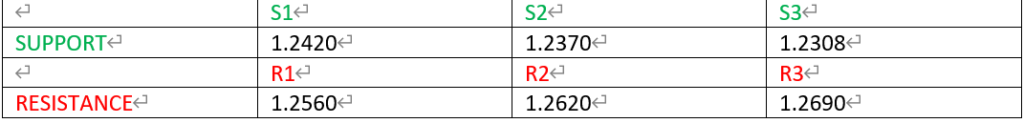
USDCAD
From the overview of price in USDCAD, the price has been in the range from the higher time. Moving down to the hourly time frame, the price is reacting to the resistance level of 1.2465 thereby forming an inverted head and shoulder pattern, and the RSI in divergence with the price of a falling wedge at that level.
PIVOT POINT: 1.2465
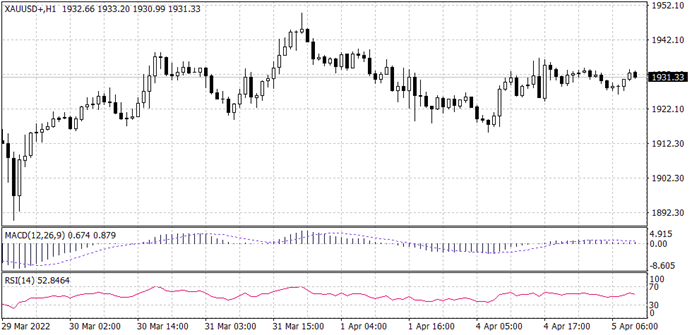
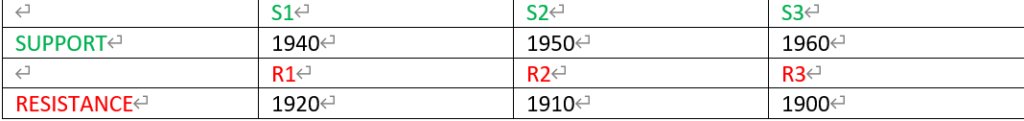
XAUUSD (GOLD SPOT)
GOLD SPOT has been in the range from the 4-hour time frame after an initial impulsive move to the bearish direction. Down to the hourly time frame, price is forming higher highs after an initial breakout from the downward trend-line. Price has formed a rejection in form of a pin-bar at the support level of 1925 and is above the centre-line on the RSI and MACD indicators.
PIVOT POINT: 1925.0
Start your trading journey with Trade Master today!