The benchmark indices on BSE and National Stock Exchange (NSE) opened on a positive note on Wednesday. The S&P BSE Sensex climbed nearly 370 points to 53,793.99 in opening deals while the Nifty 50 jumped 107.90 points to 16,121.35.
Technical analysis: From the overview of price in INDIA 50 , we could see that price is already at the support zone between 16129.2 and 16021.1 and there could be a reaction within the zone to send price to the downside. We could also see that the RSI and MACD are below the centreline which signifies a bearish continuation of price.
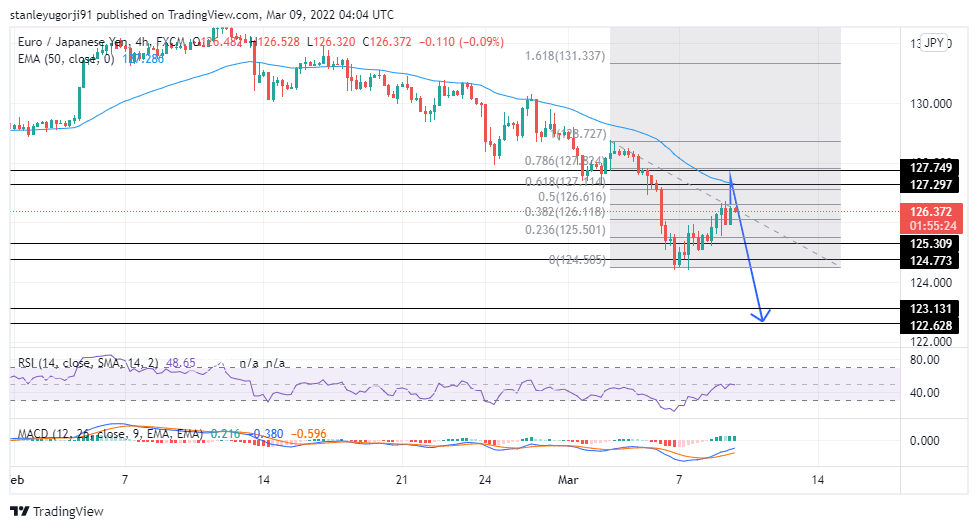
EURJPY
Technical analysis: The overall trend for EURJPY is bearish. Price is currently making pullback to the support zone between 127.749 and 127.297 which is in confluence with the FIBO retracement levels and the 50 EMA. There could be a possible price continuation to the downside when price gets to the zone. The RSI and MACD are below the centreline for added confirmation.
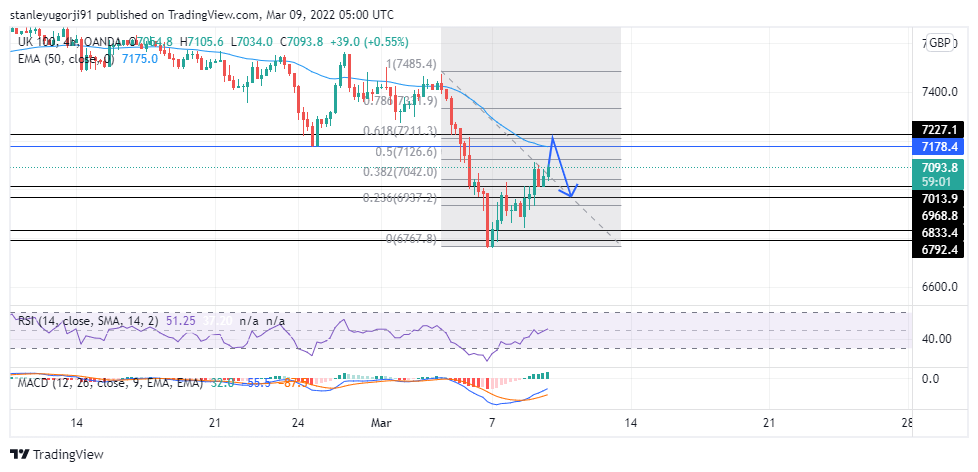
UK100GBP
London’s FTSE 100 edged higher on Tuesday, aided by strong gains in energy stocks as oil prices jumped after Britain and the United States announced Russian crude import bans, while insurer and asset manager M&G was the top index gainer on a share buyback programme.
Technical analysis: From the overview of price in UK100, we could see that price has been making higher highs in the 4h timeframe and has retested the support zone between 7013 and 6968. We should anticipate price to get the major resistance zone between 7227 and 7178 which has confluences with the 50 EMA and FIBO retracement levels. before making reversal to the downside.
Start your trading journey with Trade Master today!