April 18th Daily Analysis
April 18th Daily Analysis

S&P 500 (US500)
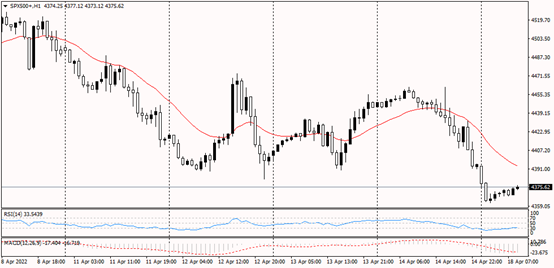
SPX500 daily chart shows a positive tilt. However, pricing appears to have broken out of the bearish flag on the hourly time frame, indicating that it will go lower. The 20-period MA is above price, confirming the S&P 500’s negative directional bias. Both the MACD and the RSI point to a price decline.
PIVOT POINT: 4,370

Sterling Pounds
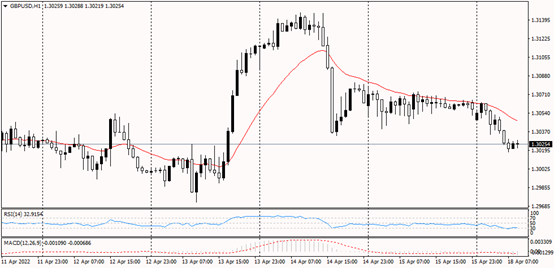
The trend appears to be bearish based on the daily chart of GBPUSD. On the other hand, cable price appears to build a light resistance around 1.3025. The price trend remains bullish unless it broke out of the daily downward channel. Both MACD and RSI both indicate a continuation of the bearish trend.
PIVOT POINT: 1.3020

Bitcoin
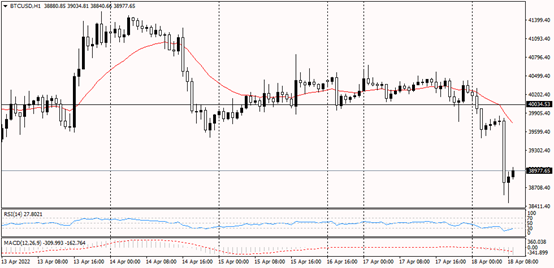
Bitcoin’s daily chart shows a bullish trend. Furthermore, the hourly chart displays a series of lower lows, indicating that the trend is bearish. Price has broken below the 20 candles moving average, confirming its hourly bias, and has broken out of the consolidation move to the downside to the level of $38,805. Both the RSI and the MACD point to a bearish trend.
PIVOT POINT: 38,805

Spot Gold
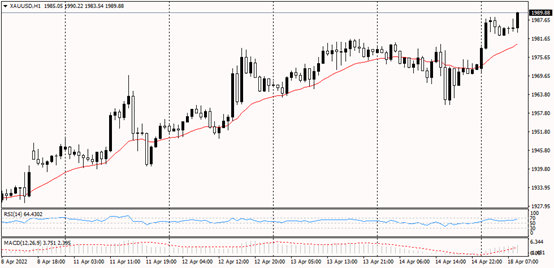
The overall trend appears to be bullish on the daily chart of Spot gold. A bullish tendency may also be seen on the hourly chart. Price is trading above the 20-candle moving average and establishing a series of higher highs. A bullish trend is confirmed by the RSI and MACD.
PIVOT POINT: 1,980

Euro
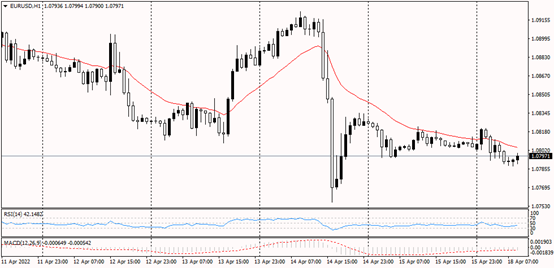
A quick glance at the EURUSD daily chart reveals a price tendency to the negative. Similarly, the hourly chart shows a bearish trend with a break to the downside from the range. As the RSI and MACD signal a bearish continuation, the 20 period MA is above price.
PIVOT POINT: 1.0795