October 12th Daily Analysis
October 12th Daily Analysis

U.S. DOLLAR INDEX (USDX)

U.S. inflation data for September is also a key point of focus for metal markets this week. Producer price inflation data is due later on Wednesday and is expected to show that price headwinds for manufacturers persisted last month.
Consumer price inflation, the more closely-watched inflation gauge, is due on Thursday and is expected to show inflation remained pinned near 40-year highs last month. Both readings, coupled with strong jobs data last week, are expected to give the Fed enough impetus to keep raising interest rates at a sharp pace. However, weakening risk appetite pushed investors to the greenback, with the dollar largely overtaking the title of Safe-Haven.
Technically:
The index is trading at the resistance level of 113.25 which may cause a high level of volatility. However, there will be two scenarios at this level. The first one, if the index broke above 113.25 it will probably head towards 114 and 114.30. on the other hand, if the index failed to penetrate the resistance, it might head towards 112 in the short run. However, the daily chart remains positive as long as the index is trading above 109.60.
Pivot Point: 113.25

STERLING POUND (GBPUSD)

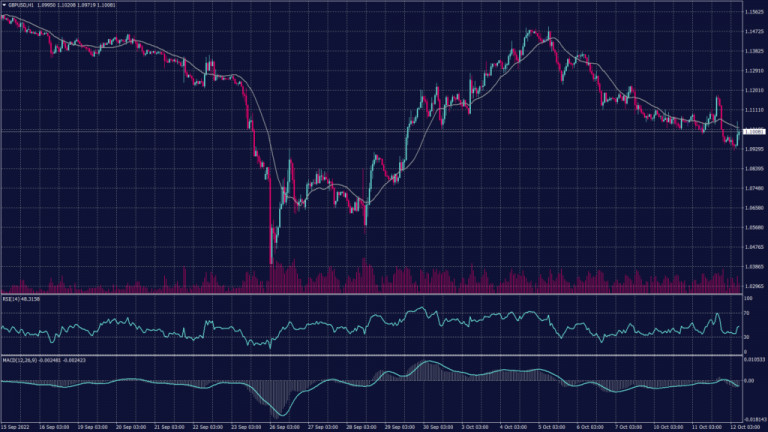
The British pound rebounded in Asian trade on Wednesday after a report said that the Bank of England signalled it may extend its bond-buying program beyond a Friday deadline if market conditions required it. The pound rose 0.3% to 1.0991, reversing overnight losses and briefly trading above 1.1.
Bailey’s warning had sent the pound plummeting to a near two-week low on Tuesday, as markets feared that a withdrawal of debt support could further stress fund managers reeling from a major sell-off in gilts. 10-year UK bond yields were up 0.8% at 4.4750 as of Tuesday’s close.
Technically:
The cable is moving in a long negative channel on the hourly chart despite the support at the 1.1000 level as the selling pressure remains strong. Meanwhile, the daily chart shows three consecutive lower tops and waiting for the confirmation of the third bottom below 1.0650. in terms of trading trend, the hourly chart indicates a continuation of the downtrend with no specific target but there will be fluctuations between 1.0950 and 1.1070.
Pivot Point: 1.1000

SPOT GOLD (XAUUSD)

Gold prices are moving in a slow fashion as investors avoid big bets ahead of key U.S. inflation data, while the minutes of the Federal Reserve’s September meeting were also in focus.
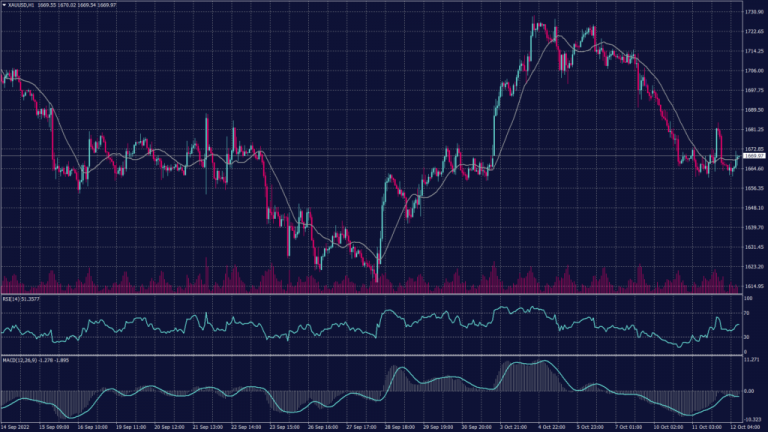
U.S. inflation data for September is also a key point of focus for metal markets this week. Producer price inflation data is due later on Wednesday and is expected to show that price headwinds for manufacturers persisted last month. Spot gold fell 0.1% to $1,664.82 an ounce, while gold futures fell $2 to $1,671.45 an ounce.
Technically:
Gold prices are heading downwards on the hourly chart reaching the support at $1,665 per ounce. However, the current support is not strong enough to hold against the current selling pressure which might break the supports at 1,665 and 1,659 to head towards 1,650.
Meanwhile, the daily chart remains within the downtrend channel heading towards 1,620 on the foreseen time frame.
Pivot Point: 1,665

WEST TEXAS CRUDE (USOUSD)

Oil prices fell further on Wednesday, extending steep losses from the prior sessions amid growing concerns that a new COVID outbreak in China and a worsening global economic outlook will severely crimp demand.
Brent oil futures dropped 0.7% to $93.66 a barrel, while U.S. West Texas Intermediate futures fell 0.8% to $88.58 a barrel. Oil prices fell sharply in recent sessions as major Chinese cities including Shanghai and Shenzhen ramped up COVID testing and introduced new curbs amid a spike in infections.
Pivot Point: 88.40
