April 19th Daily Analysis
April 19th Daily Analysis

Dow Jones (US30)
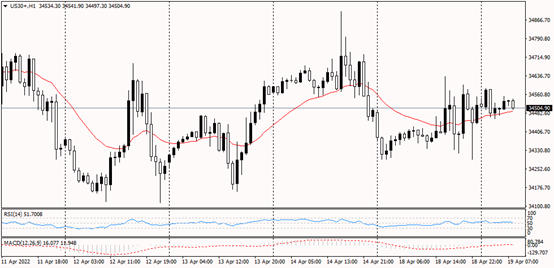
Dow Jones Industrial Average daily chart indicates an upward trend. However, the trend appears to be bearish on the hourly time frame since it has been making a succession of lower lows to the downside, which is a strong corrective move on the daily time frame. Price appears to be going in a horizontal manner with the 20 period MA moving in between prices, indicating an indecisive move according to the RSI and MACD.
PIVOT POINT: 34,575

Ethereum (ETHUSD)
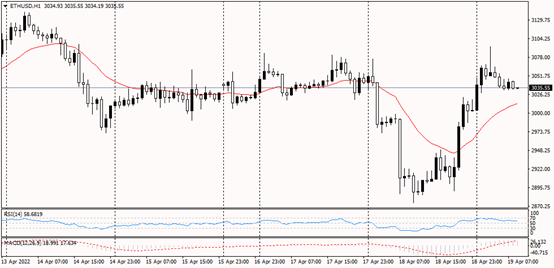
Ethereum’s general trend appears to be bullish from a daily chart perspective. The hourly time frame, on the other hand, reveals a negative trend in price since pricing has made a succession of lower lows. The RSI and MACD both support the price’s downward trend.
PIVOT POINT: 3,020

Swiss Franc (USDCHF)
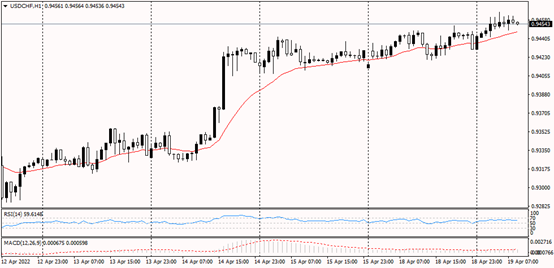
The overall trend of the daily chart of the USDCHF appears to continue the upward trend. Price has reached an all-time high of 0.9465 since March 16th, and it is also in divergence with the RSI and MACD indicators, indicating a slight likelihood to reverse the trend.
PIVOT POINT: 0.9465

Euro
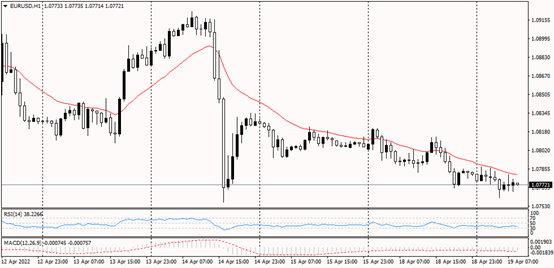
EURUSD daily chart shows an overall bearish trend. Similarly, the hourly time period indicates price movement downward, resulting in lower lows. Price is currently trading within the 1.0770 level, which is in divergence with the RSI signal, indicating a likely price reversal to the upside. A price reversal is also seen on the MACD.
PIVOT POINT: 1.0770

Spot Gold
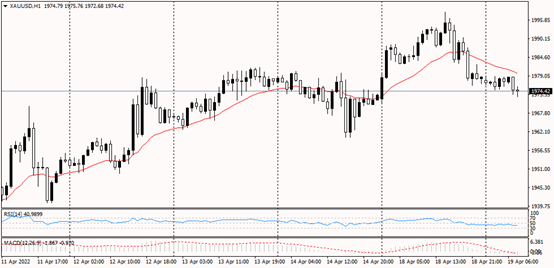
The daily trend in spot gold appears to be bullish. Similarly, the hourly chart depicts an upward price movement as the price has maintained the upward trend-line. The price is currently trading at 1,975, which is intersecting with the rising trend-possible line’s bounce. Price has yet to make a substantial move, thus the MACD and RSI are now undecided.
PIVOT POINT: 1,975
