May 17th Daily Analysis
May 17th Daily Analysis

U.S. DOLLAR INDEX (USDX)
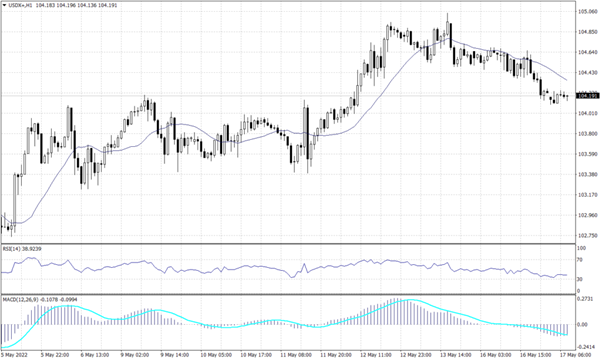
The U.S. Dollar index is running into a corrective movement that appears on the daily chart, but the overall trend remains positive. The dollar retreated from its 20 years high under heavy selling pressure. Despite today’s retreat, the USDX cemented its long-term upward trend remaining above the support of 103.60 and forming a continuation pattern.
On the daily chart, the index shows a continuation pattern towards 105.30 under the condition that it never closes away from 104.10. Otherwise, in case the index closed between 103.60 and 104.10 it is likely to trade horizontally before testing the rise again. However, on the hourly chart, technical indicators and trend lines expect the index to trade lower.
PIVOT POINT: 104.10

EURO (EURUSD)
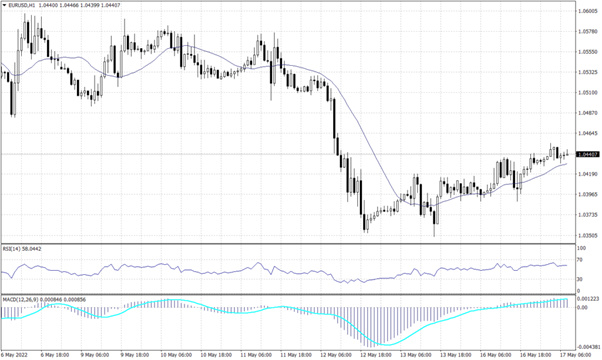
The Euro remains in a downtrend on the long-term chart, while it shows a short correction movement on the hourly chart based on the correction of the U.S. Dollar movement. Technical indicators signal a continuation towards 1.0350. Meanwhile, in the longer term, the pair is set to continue its primary downtrend.
PIVOT POINT: 1.0440

STERLING POUNDS (GBPUSD)
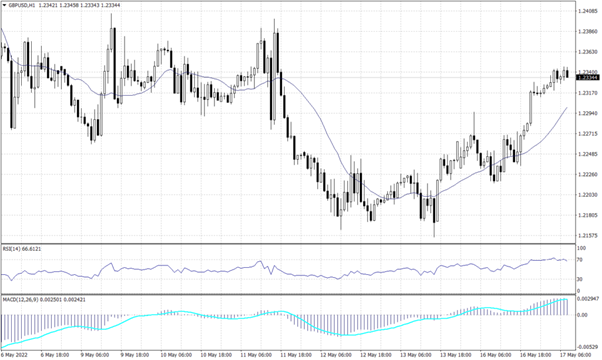
The Cable is set to continue the primary decline after closing the short-term corrective trend. On the daily chart, the pair is expected to fall below 1.2100, while the hourly chart shows a likelihood to reverse sharply. The RSI and MACD are showing signals for a further decline in a slow fashion, while price action retains the reading of 1.2100 during the day.
PIVOT POINT: 1.2300

JAPANESE YEN (USDJPY)
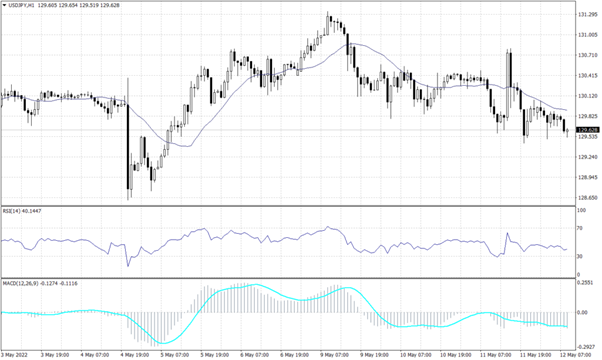
The USDJPY pair broke below the support of 130.30 on Friday and formed a declining pattern on the hourly chart. Meanwhile, on the daily chart, the pair remains in the uptrend unless it broke below the support of 128.70. While the moving average reading indicates that the current level is critical resistance, MACD and RSI readings are neutral.
PIVOT POINT: 129.30

SPOT GOLD (XAUUSD)
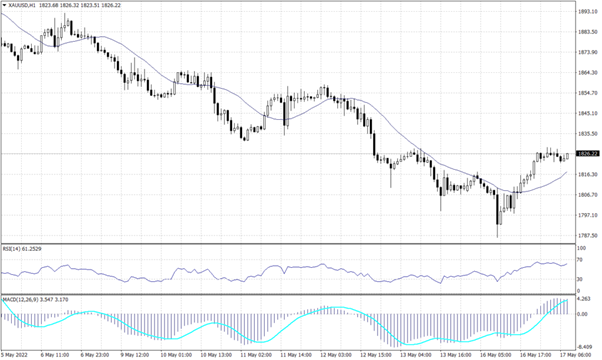
Spot Gold sharply declined to its lowest since late January at $1,786 per ounce yesterday before bouncing back to 1,825. The precious metal retains its negative trend on the daily chart, and it is likely to continue the downward to settle the day towards $1,785.
Meanwhile, the hourly chart shows support at the current levels that might slow down the decline. Furthermore, both the RSI and the MACD imply that the bearish trend will continue.
PIVOT POINT: 1,825

WEST TEXAS CRUDE (USOUSD)
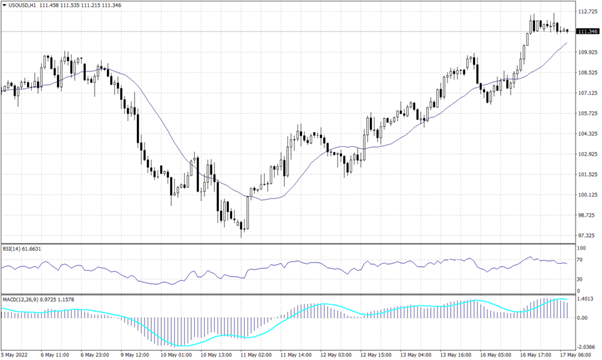
West Texas crude oil bounces back from the support of $97 per barrel on the daily chart and sets support above $111. Meanwhile, on the hourly chart, the crude shows support at $107.10 and $111.30. The oil is heavily affected by the decision to loosen Covid restrictions in China, in addition to the supply worries in Europe.
Due to the heavy buying pressure, technical indicators show a possibility to see crude oil lower at $107. However, price action and moving average are showing a higher probability to continue climbing.
PIVOT POINT: 111.00
