April 14th Daily Analysis
April 14th Daily Analysis

U.S. dollar index (USDX)
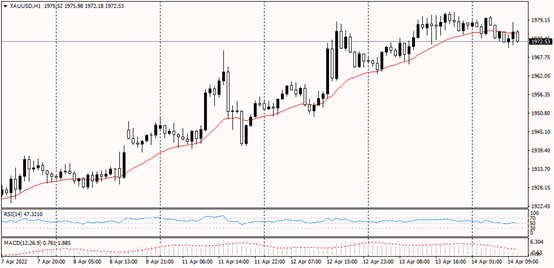
From the overview of the chart of Gold Spot (XAUUSD) in the daily time frame, the overall trend is bullish. Similarly, from the hourly chart, Gold Spot (XAUUSD)is indicating pressure from the bulls and has tested the recent highs made on Wednesday near $1,980 before a pullback to the $1,970 level. The US dollar is trading above the 20 candles moving average which signifies a bullish move to the upside. The RSI is also indicating price continuation to the upside.
PIVOT POINT: 1,970

Sterling Pounds (GBPUSD)
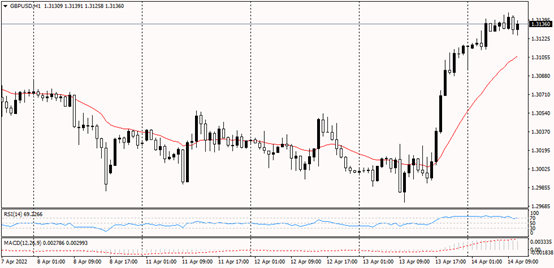
The downward trend from the daily chart of GBPUSD has continued since May last year, allowing bears to push down price to the next support level at 1.3000 which may continue to hold sellers at bay. After failing to break below this level, GBPUSD rebounded, reaching the next zone of resistance at 1.3100. however, the hourly chart shows a break in structure of price to the upside towards the level 1.3160. furthermore, the RSI shows an overbought situation which may lead to a corrective move of price.
PIVOT POINT: 1.3160

Ethereum (ETHUSD)
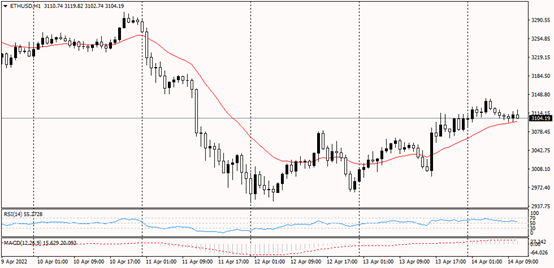
The daily chart of Ethereum (ETHUSD) shows an overall bullish trend. However, the hourly chart shows a bearish trend as price is within the 32.8 and 50 Fibonacci level which is in intersection with the downward trend line at the level of $3,115. The stochastic oscillator show that price has moved from the overbought zones which may lead to a continuation of price to the downside.
PIVOT POINT: 3,115

Euro (EURUSD)
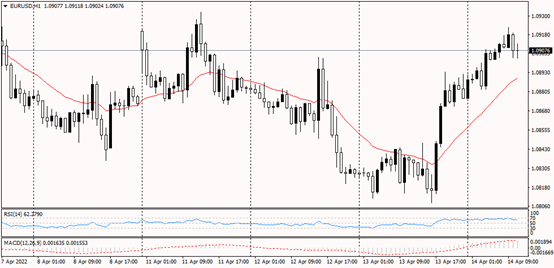
From the daily chart of Euro (EURUSD), the overall trend is bearish. After failing to create new lows from the hourly chart, price bounced off from the support level of 1.8080 to the level 1.9045. The RSI shows an overbought situation while the MACD signals a change in direction of price to the downside.
PIVOT POINT: 1.0905

WTI (USOIL)
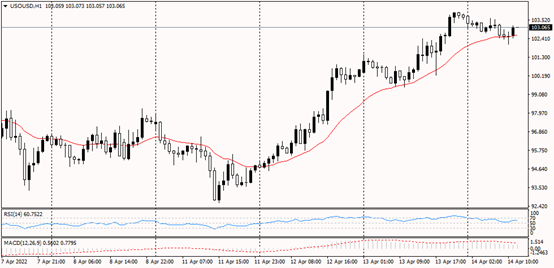
From the overview of price in WTI, the daily chart shows a change in the overall bias to the upside. Furthermore, the hourly chart shows a series of higher highs which signifies an upward trend. There seems to be a minor corrective move to the level 102.70 which intersects the 20 period moving average. The RSI is above the 50 line which signifies bullish continuation.
PIVOT POINT: 102.70
