April 12th Daily Analysis
April 12th Daily Analysis

Australian dollar (AUDUSD)
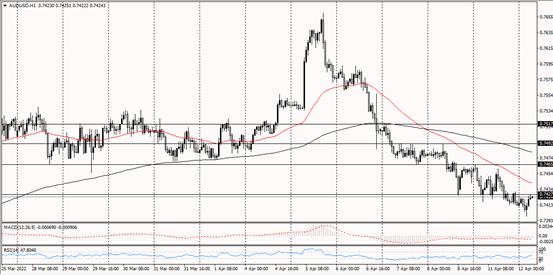
The Aussie has been in an overall uptrend from the daily time frame. However, the trend in the hourly time frame is bearish and is also trading below the 20 periods MA. The RSI and MACD are moving below the centre-line which indicates a bearish momentum of price.
PIVOT POINT: 0.7430

Canadian Dollar (USDCAD)
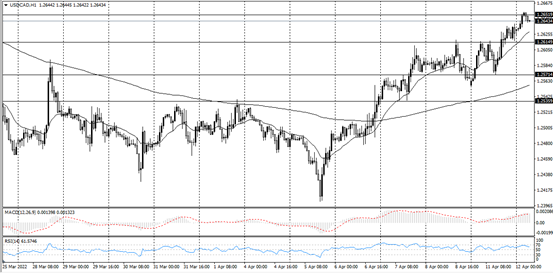
From the overview of price in USDCAD, the price seems to be moving horizontally from the daily time frame. However, from the hourly time frame, the price looks bullish and is trading above the 20 period MA at the level of 1.2650. Similarly, the technical indicators show that price is in a continuous trend to the upside.
PIVOT POINT: 1.2650

Dow Jones (US30)
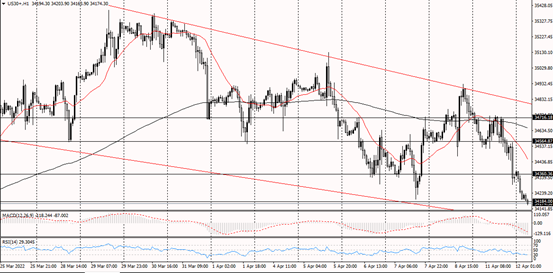
The overall trend for the GBPUSD from the daily time frame looks bearish. Similarly, the hourly time frame shows the price moving to lower lows. Price is trading below the 20-period moving average, while the RSI and MACD both show that the price is in a continuous trend to the downside.
PIVOT POINT: 1.3020

Spot WTI (USOUSD)
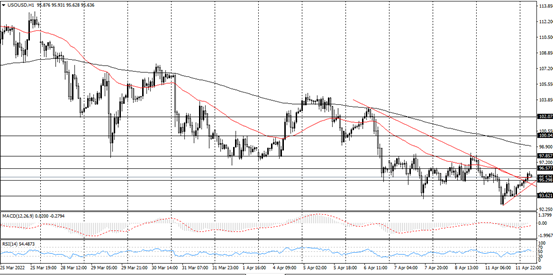
Looking at the daily time frame of WTI (US OIL) price, the trend from the daily time frame looks bullish. But from the hourly time frame, the price has been moving to the downside and at the level of 95.30 which has an intersection with the 20 periods MA. The MACD is below the centre-line which shows a continuation of price to the downside.
PIVOT POINT: 95.30

Spot Gold (XAUUSD)
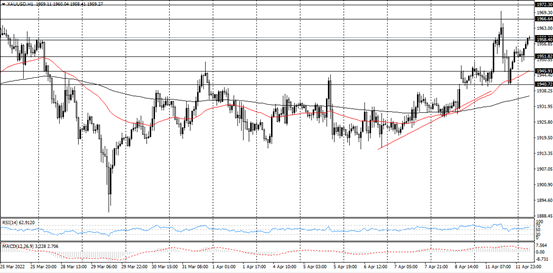
In the overview of price in XAUUSD, the trend in the daily time frame has been horizontal. However, the hourly time frame shows an upward movement of price and price trading above the 20 periods MA. The RSI and MACD technical indicators, both confirm a likelihood of a continuation of the uptrend.
PIVOT POINT: 1,960
