August 08th Daily Analysis
August 08th Daily Analysis

U.S. DOLLAR INDEX (USDX)
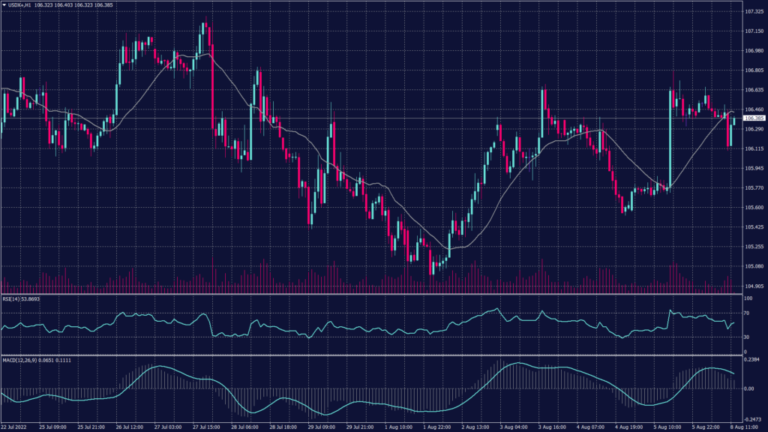
The dollar index stood at 106.77, while traders currently see a high probability the Fed will continue the pace of 75 basis-point interest-rate increases for its next policy decision on September 21. The focus this week will be on the U.S. consumer price index on Wednesday to see if it will solidify the odds for super-sized rate rises.
The 10-year yield stood at 2.8470%, sticking close to the two-week high of 2.8690% touched Friday. The negative spread between the two- and 10-year yields was 42 basis points, having hit 45 basis points on Friday, the most since August 2000. An inverted yield curve is widely interpreted as a pre-cursor to a recession.
Technically:
The dollar index remains positive on the daily chart as long as it commits to the uptrend above 105.60. however, if the index declined below the level at 104.30 it will most likely fall towards 103.65.
Meanwhile, the hourly chart shows fluctuations between 105.70 and 106.50. However, technical indicators show mixed signals but weighing a slight decline towards 105.50.
PIVOT POINT: 106.40

JAPANESE YEN (USDJPY)
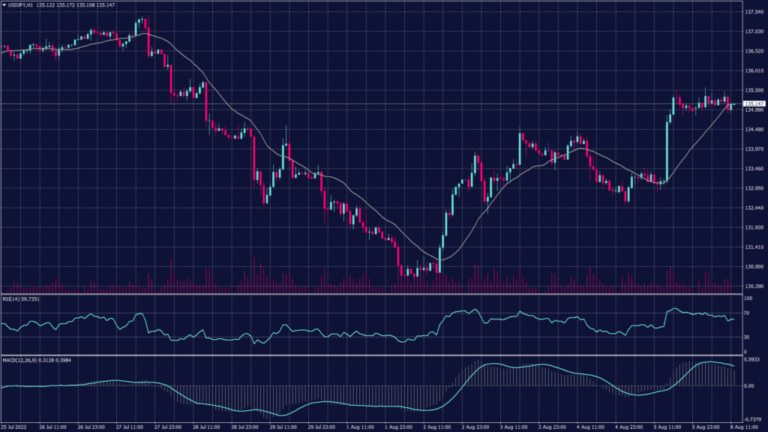
The Japanese yen fell 0.3% against the greenback to 135.34 and was the worst performer among its peers in Asia. Japanese official reports included the first current account deficit in five months in June, as rising commodity prices saw the value of imports largely eclipse exports. Additionally, the yen remains pressured by expectations that the Fed will hike interest rates sharply when it meets in September.
The pair broke penetrated the resistance at 134.40 and moved steadily above 135.00 cementing the impulse movement towards 135.70 and maybe 136.10. However, the daily chart remains trending upwards and will remains so as long as the pair trading above 130.00.
PIVOT POINT: 135.10

CHINESE YUAN (USDCNH)
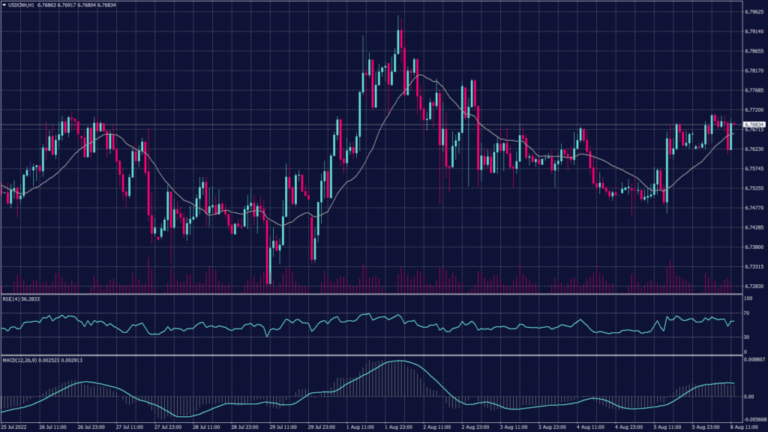
The Chinese yuan was volatile during the morning trades around 6.7620, as investors weighed robust exports against a smaller-than-expected rise in Chinese imports. While China’s trade balance surged to a record high in July, a smaller-than-expected rise in imports raised concerns over sluggish demand in the country. The Chinese data comes just as the country begins rolling back COVID-related lockdowns.
The pair hit a resistance at 6.7700 and was moving below it during the early trades but it is likely to penetrate it to continue the uptrend. The pair remains positive on both the hourly and daily charts. Meanwhile, the technical indicators show neutral signals.
PIVOT POINT: 6.7690

SPOT GOLD (XAUUSD)
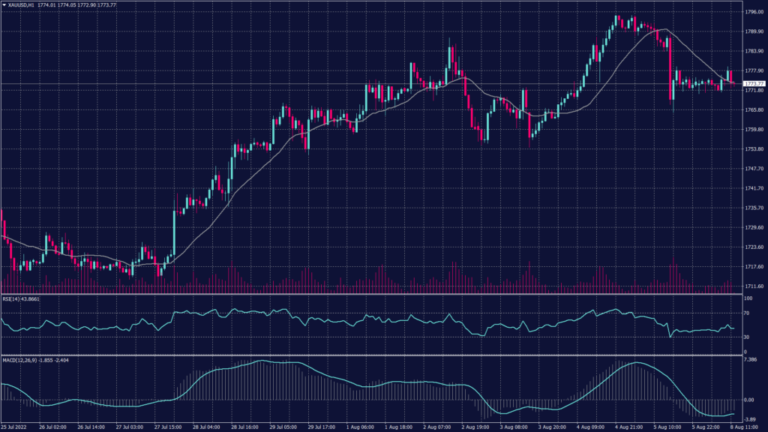
The precious metal commits to the downtrend on the daily chart and will remain so unless it broke above the channel at 1,800. Meanwhile, the hourly chart shows a slight support above 1,770 but remains indicating a downward movement towards 1,750 once broke below 1,770.
Technical indicators signal an intense fluctuation between 1,770 and 1,778 but both RSI and MACD support the theory of further decline below 1,770.
PIVOT POINT: 1,777

West Texas Crude (USOUSD)
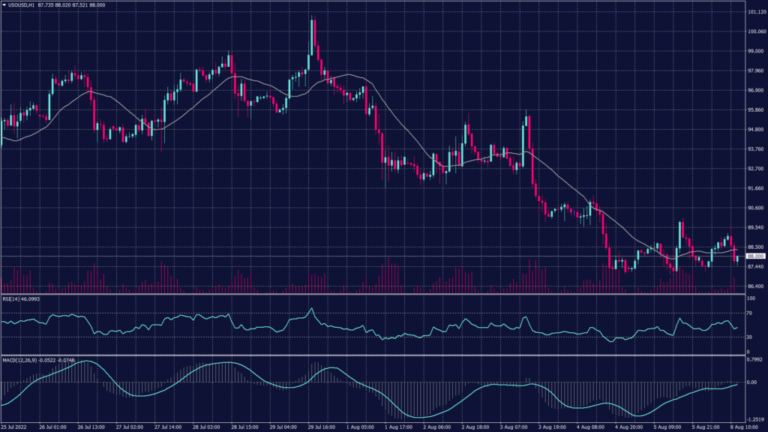
Oil prices sank in early trade on Monday, extending losses from last week as signs of weak Chinese consumption raised concerns over slowing demand for crude. Crude Oil WTI Futures sank 0.9% to $88.19 a barrel, while Brent Oil Futures dropped 0.6% to $94.06. Both contracts were trading at their lowest levels since late-January.
Crude markets were dealt a fresh blow by data from China showing that imports grew at a weaker-than-expected rate in July- furthering a trend of slowing demand in one of the world’s largest oil importers.
Technically:
WTI is also trading lower and moving downward due to the lower demand and high sell-off below $89.50 per barrel. However, WTI is trading at the support of 87.50 but indicates a high probability of breaking below towards $85 a barrel unless the sell-off pressure was met with buying force.
PIVOT POINT: 87.50
