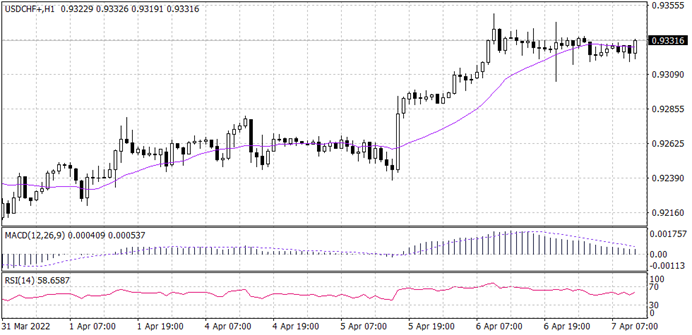
The overall trend from the daily time frame for USDCHF remains bullish. From the hourly time frame, it is also seen clearly that the price has been making a series of higher highs and is currently at 0.9330. There is a possibility of the price retesting the support level of 0.9300 before continuing in its bullish direction. The RSI is above the centre-line which adds to the movement of price to the upside.
PIVOT POINT: 0.9335
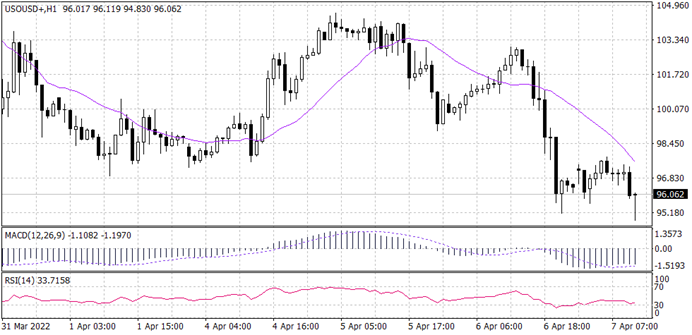
WTI (US OIL)
From the daily time frame of WTI (US OIL), the trend is bearish. Price has made a pullback or a corrective move to the level of $97.60 a barrel. There is a possible retest of the 20-period moving average level at 97.59 before the price continues to the downside. The RSI is below the centre-line which indicates a possible bearish momentum of price to the downside.
PIVOT POINT: 97.60
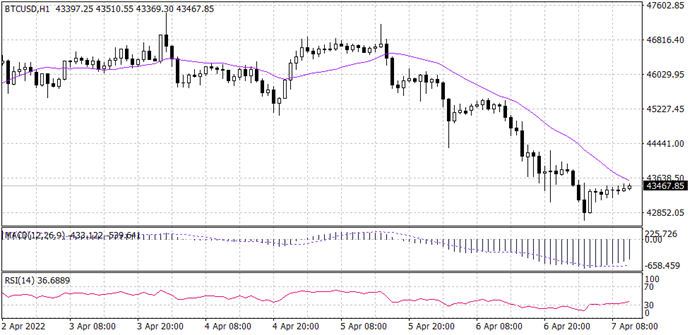
BTCUSD
From the overview of the price on the daily time frame, the price of Bitcoin looks bullish. However, from the hourly time frame, the price has been making a series of lower lows to the downside. Price is currently making a pullback to the 20 period MA at the level of 43,660 which is likely to push down the price in the bearish direction. The RSI and MACD both show a corrective move of price to the level of 43,660.
PIVOT POINT: 43,660
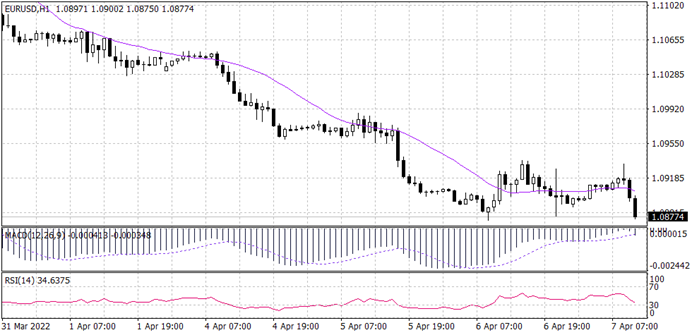
EURUSD
EURUSD is in an overall bearish trend from the daily frame. Similarly, on the hourly time frame price has been making a series of lower lows to the downside and is currently within the 0.8940 level. There is a likelihood of price going lower as is seen in the RSI and MACD indicator which shows price is in bearish momentum.
PIVOT POINT: 1.0940
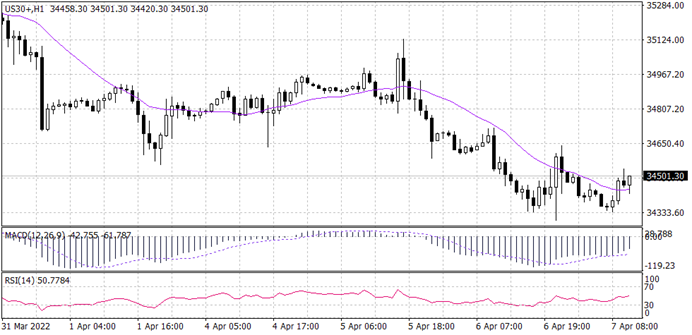
Dow Jones (US 30)
From the overview of the price of the Dow Jones (US 30), the daily time frame shows a bullish trend. Price has made a rebound around the 34,330 level which has an intersection between the upward trend-line and downward trend-line respectively. The RSI and MACD both show a rejection of price around 34,330.
PIVOT POINT: 34,330
Mulakan Perjalanan Perdagangan Anda Dengan Trade Master Hari Ini!