October 05th Daily Analysis
October 05th Daily Analysis

U.S. DOLLAR INDEX (USDX)

The dollar steadied on Wednesday after a sharp rate rise in New Zealand poured cold water over hopes for a pause or slowdown in the U.S. Federal Reserve’s intentions for aggressive hikes.
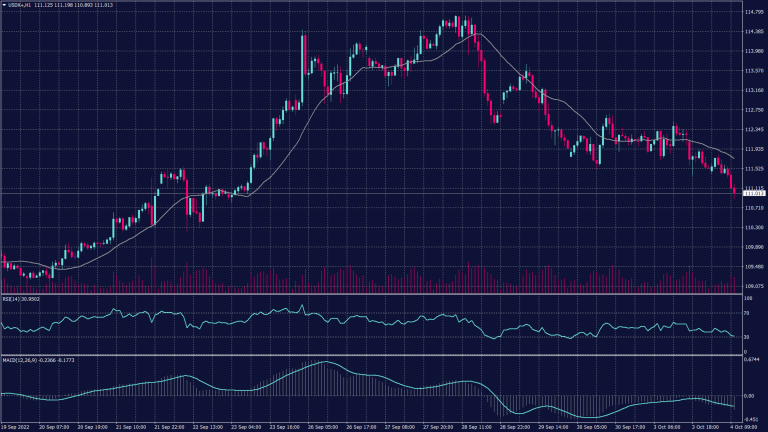
The dollar index was down about 4% since hitting a record high of 114.78 last week, steadied at 110.30.
Technically, the index remains positive on both the daily and hourly charts after the correction. The hourly chart is bouncing after the correction that hit 111.00. Meanwhile, the daily chart shows strong resistance below 112.30. On the other hand, technical indicators show a possible continuation of the uptrend on MACD figures and a horizontal trend signal on the RSI on the daily chart.
The index remains positive as long as it is trading above 109.25, otherwise, in the case of breaking below this level it is expected to change direction. On the other hand, the hourly chart shows a continuation to the downtrend. The index is seen heading to 109.90 based on the current readings.
Pivot Point: 110.50

EURO (EURUSD)

Euro zone government bond yields edged higher but stayed significantly below their multi-year highs as concerns about systemic risk and economic slowdown drove investors to lower bets on terminal rates.
Lingering hopes of a less aggressive monetary policy stance are likely to fade if inflation keeps surprising on the upside and the economy shows some strength. Meanwhile, Germany’s 10-year yield, the benchmark of the bloc, rose 3 basis points (bps) to 1.92%. It reached its highest since end-November 2011 on Tuesday last week at 2.35%.
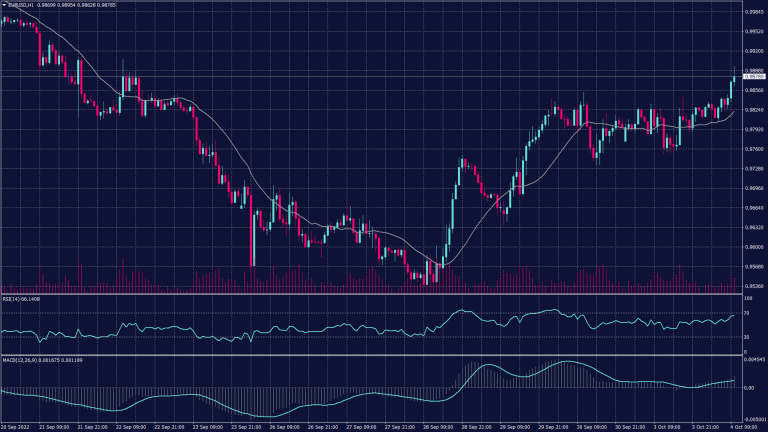
Technically, EURUSD was down 0.45% at $0.9938 while it remains negative on the daily chart as long as it trades below the parity levels.
Pivot Point: 0.9945

SPOT GOLD (XAUUSD)

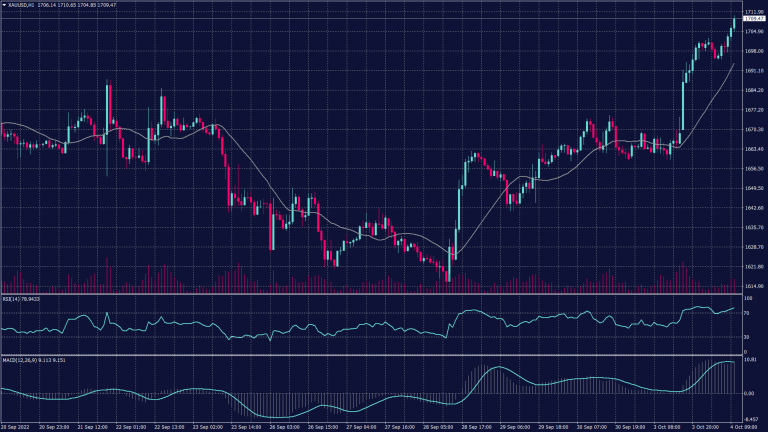
Gold came under renewed bearish pressure and declined toward $1,710 during the European trading hours on Wednesday. The benchmark 10-year US Treasury bond yield is up more than 2% on the day, forcing XAU/USD to stretch lower ahead of US data.
Gold price took advantage of the upside break of the falling trendline resistance at the start of the week and extended its upsurge beyond $1,700. However, the bearish 50-Daily Moving Average at $1,724 played a spoilsport and tempered its rally.
The pullback in the bullion appears temporary, as the technical setup continues to favour bulls. A sustained break above the 50 DMA is needed to challenge the September highs at $1,735, above which the $1,750 psychological level will come into play.
On the downside, the previous critical resistance now is a support at $1,700 could offer temporary reprieve to buyers, below which the previous day’s low of $1,695 could be revisited. However, the support at $1,680 will be the last line of defence for gold bulls.
Pivot Point: 1,710

WEST TEXAS CRUDE (USOUSD)

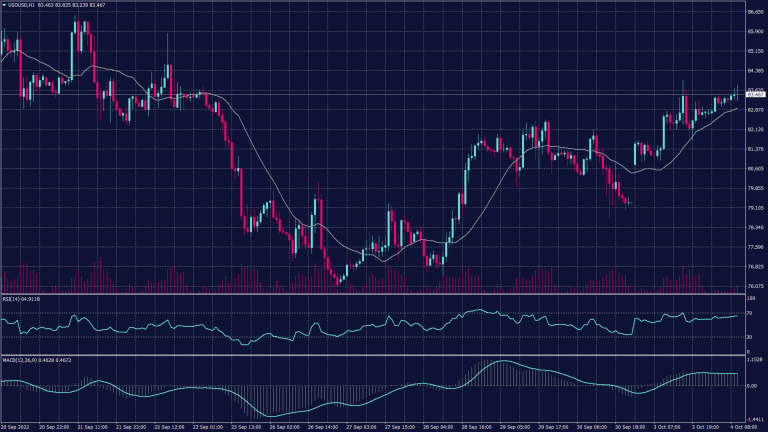
Oil rose by nearly $3 a barrel on Tuesday on expectations of a large cut in crude output from the OPEC+ producer group and as a weaker U.S. dollar made oil purchases less expensive.
The Organization of the Petroleum Exporting Countries and its allies, known as OPEC+, look set to cut output when they meet on Wednesday. The move would squeeze supply in an oil market that energy company executives and analysts say is already tight due to healthy demand, a lack of investment, and supply problems. Meanwhile, Brent crude settled at $91.80 a barrel, up 3.3%, and WTI crude closed 3.5% higher at $86.52 a barrel.
Pivot Point: 85.40
