April 4th Daily Analysis
April 4th Daily Analysis

US INDEX

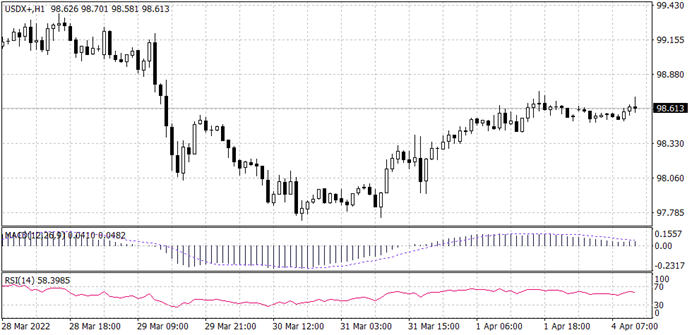
From the higher time frame, the overall trend for US INDEX is bullish. Down to the hourly time frame price seems to be in a range after an initial impulsive move in the bullish direction as the 200 EMA is moving in between prices. Price is currently retesting a minor support level of 98.50 which is in confluence with the retest of the 200EMA. The RSI and MACD are above the centre-line for price continuation in the bullish direction.
PIVOT POINT: 98.50

GBPUSD

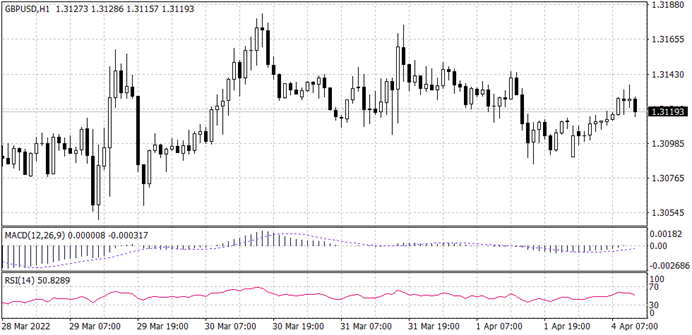
From the overview of price in GBPUSD, the trend looks bearish. Price is trading below the 200 EMA and has also broken the upward trend line and is about to retest the trend-line which is in confluence with the support level of 1.3145 before continuing bearish. The MACD is below the centre-line for a possible price continuation in the bearish direction.
PIVOT POINT: 1.3145

USDJPY

The U.S. State Department spokesperson Ned Price said on Thursday that Russian President Vladimir Putin’s demand that foreign buyers pay for Russian gas in robles is a sign of Moscow’s economic and financial “desperation” caused by Western sanctions in response to the invasion of Ukraine. European nations, which rely heavily on Russian gas, have rejected the demand.
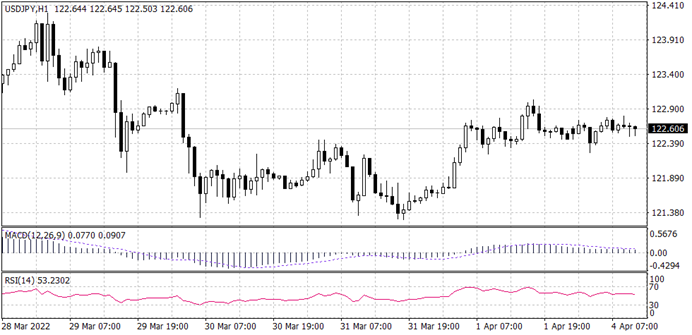
From the overview of price in USDJPY, the overall trend looks bullish. Price is trading above the 200 EMA, and it is currently retesting the support level of 122.30. The RSI and MACD are above the centre-line which indicates price continuation in the bullish direction.
PIVOT POINT: 122.35
