June 28th Daily Analysis
June 28th Daily Analysis

U.S. DOLLAR INDEX (USDX)
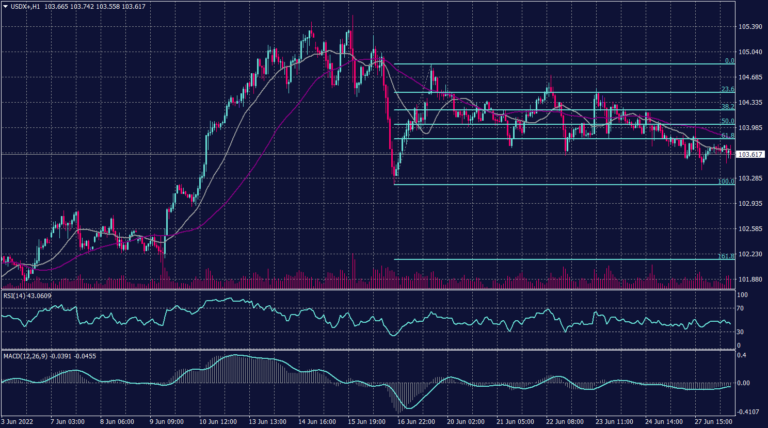
The U.S. dollar edged lower versus major rivals as investors weighed expectations on inflation and interest rate hikes. The dollar index struck a two-decade high of 105.79 this month and was last traded at 103.93.
Meanwhile, the daily chart indicates a continuation of the uptrend in the long term under the condition of holding above 104. Technical indicators can’t confirm the continuation while moving averages show horizontal signals.
The hourly chart shows a horizontal movement with a tendency for a decline if the prices broke below the support at 103.50.
PIVOT POINT: 104.00

EURO (EURUSD)
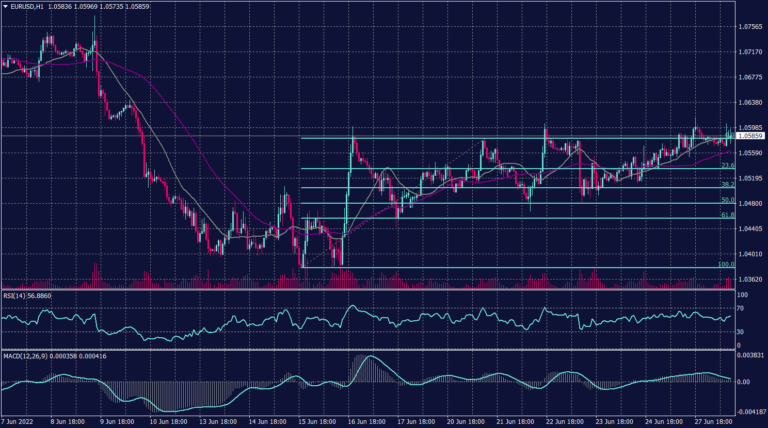
The euro held onto its recent gains on Tuesday ahead of European inflation figures this week that are expected to run hot and a speech from central bank chief Christine Lagarde, while a rally in oil prices boosted commodity currencies. The euro rose 0.28% overnight and at one point poked above its 50-day moving average. It last sat at $1.0574. German inflation figures are due on Wednesday, French data on Thursday and euro zone numbers on Friday.
Technically:
On the hourly chart, the Euro tested the resistance at 1.0600 for the third time with shorter swings which indicates a possibility of breakthrough. The EURUSD was optimistic this morning and traded in a corrective trend between 1.0550 and 1.0600. Meanwhile, the pair remains in the declining channel towards 1.0400, while technical indicators confirm the decline on the daily chart.
PIVOT POINT:1.0600

STERLING POUND (GBPUSD)
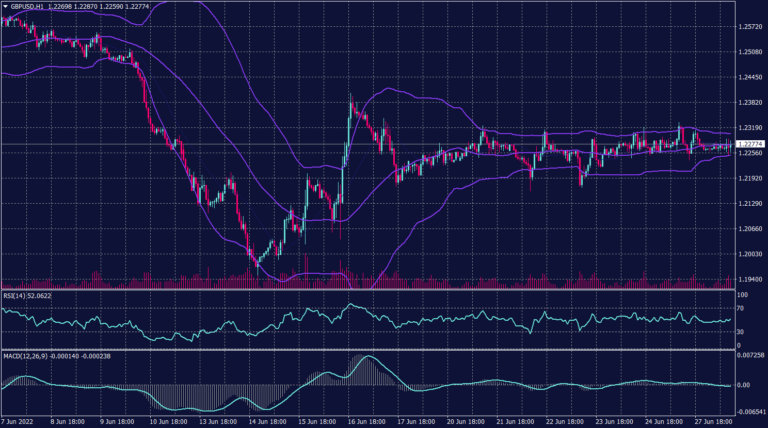
The sterling pound remains moving horizontally and shows a cautious trading environment. On the daily chart, the pair remains to weaken and targets its lowest level since March 2020 between 1.1446 and 1.1410. The cable cannot find shelter in the upcoming BOE statement unless it massively exceeded market expectations.
PIVOT POINT:1.2280

SPOT GOLD (XAUUSD)
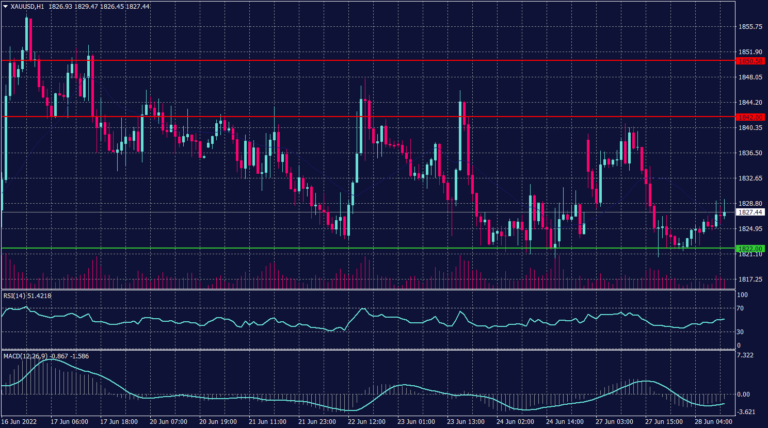
Gold rose Tuesday morning in Asia as the U.S. dollar weakened on softening inflation expectations.
Gold futures inched up 0.12% to $1,826.95. Softening inflation expectations prompted a reassessment of the prospects for aggressive interest rate hikes.
Other precious metals were mixed, silver inched down 0.02%. Platinum inched up 0.01% while palladium climbed 0.94%.
Technically:
Gold is expected to remain strong as long as it is traded above 1,820 and is expected to trade above 1,835 before the European session. The hourly chart shows strong support above 1,820 and signals a possibility of trading above 1,830. Meanwhile, technical indicators are neutral and the 20-period moving average is positive above 1,825.
The daily chart, however, shows a horizontal trend and an increased possibility of a decline between 1,810 and 1,800. Additionally, price action confirms the decline on the daily chart under the condition of breaking below 1,825.
PIVOT POINT: 1,830

WEST TEXAS CRUDE (USOUSD)
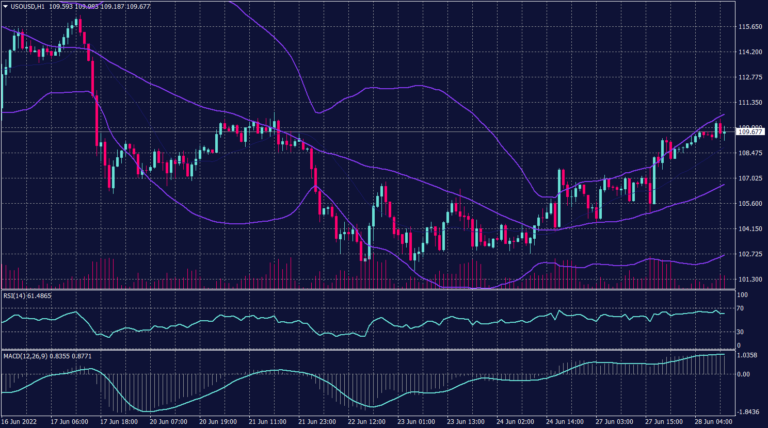
Oil was up on Tuesday morning in Asia amid tight supplies. But leaders of the Group of Seven (G7) nations vowed to add pressure on Russia while lowering energy prices.
Brent oil futures rose 1.21% to $112.32 and crude oil WTI futures rose 1.20% to $110.89. Oil prices stayed above $110 per barrel as crude and oil product supplies remained tight after the West posed sanctions on Russian oil.
Technically:
On the hourly chart, WTI prices show a decrease in volume traded due to the worries about G-7 decision about the Russian sanctions. Meanwhile, WTI shows a corrective movement bouncing from $104 towards the resistance of $109.80.
However, the daily chart confirms the high probability of the decline and targets $98 a barrel before any serious gains happens.
PIVOT POINT: 109.80
