April 13th Daily Analysis
April 13th Daily Analysis

Sterling pound (GBPUSD)
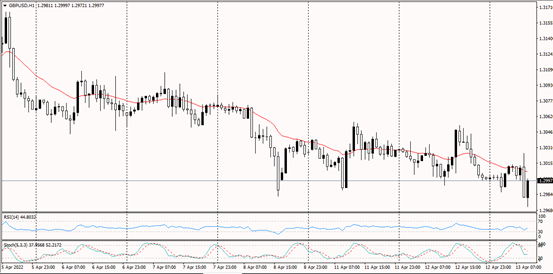
Cable’s overall trend remains bearish in the daily time. Similarly, the trend can be seen consolidating or moving horizontally after an initial move to the downside. Price is currently at the level of 1.3010 intersecting the 20 periods MA. Both the MACD and RSI are indicating a bearish continuation of price.
PIVOT POINT: 1.3010

Euro (EURUSD)
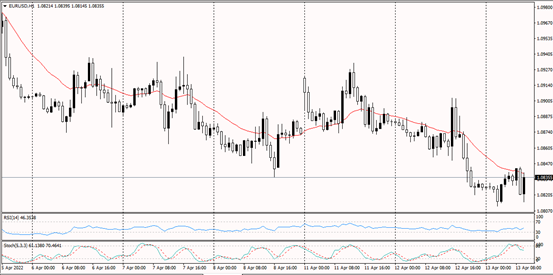
From the overview of the price in ETHUSD, the daily time frame seems to be in a bearish trend. Also, from the hourly time frame, the price seems to be moving to the downside after breaking the initial low. The MACD and RSI show a movement of the price to the downside.
PIVOT POINT: 1.0845

Spot GOLD (XAUUSD)
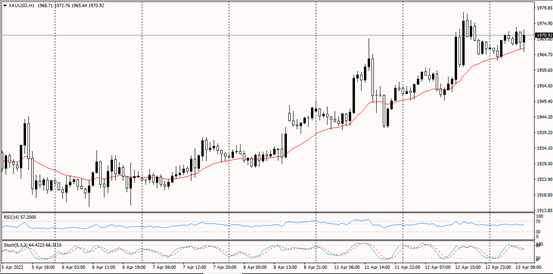
The daily trend for Gold Spot is looking bullish. Similarly, the hourly time frame is also looking bullish as the price has been making a series of higher highs and trading below the 20 period MA which is also in line with the bounce of price on the upward trend-line to the upside. The MACD and RSI are above the centre-line which shows bullish continuation of price.
PIVOT POINT: 1,970

WTI crude oil (US OIL)
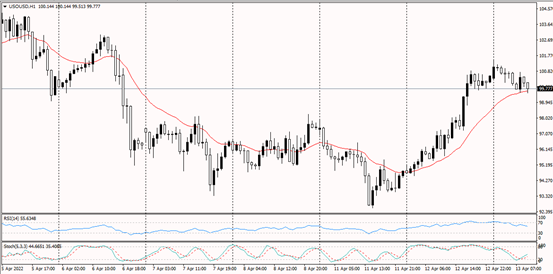
In the overview of the price of WTI, the daily time frame seems to have change its overall view to the upside after breaking the downward trend-line to the upside as it is also trading below the 20 period moving average. The Stochastic Oscillator shows that price is almost at the oversold region which indicates a possible continuation of price to the upside. The RSI line is above the centre-line which also shows a continuation of price to the upside.
PIVOT POINT: 99.80

FTSE 100 (UK100)
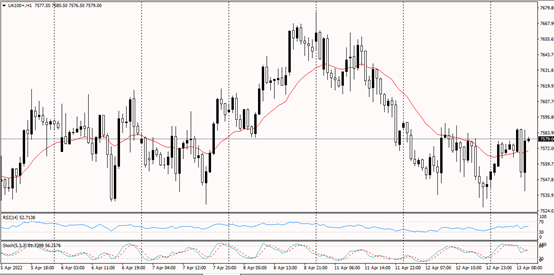
The FTSE 100 overall trend from the daily time frame looks bullish. However, from the hourly time frame, the price can be seen moving horizontally. The RSI and MACD both show an indecisive movement of price as the indicator lines are moving in-between the centre-line.
PIVOT POINT: 7,585
