October 11th Daily Analysis
October 11th Daily Analysis

U.S. DOLLAR INDEX (USDX)

Strong U.S. labor data and an expectation of inflation figures on Thursday to remain stubbornly high have all but dashed bets on anything but high interest rates through 2023 and are driving the dollar back toward multi-decade highs.
Risk appetite was also hurt on Tuesday after Russia rained missiles upon Ukraine’s cities on Monday in retaliation for the blast that damaged the only bridge linking Russia to the annexed Crimean Peninsula.
Technically:
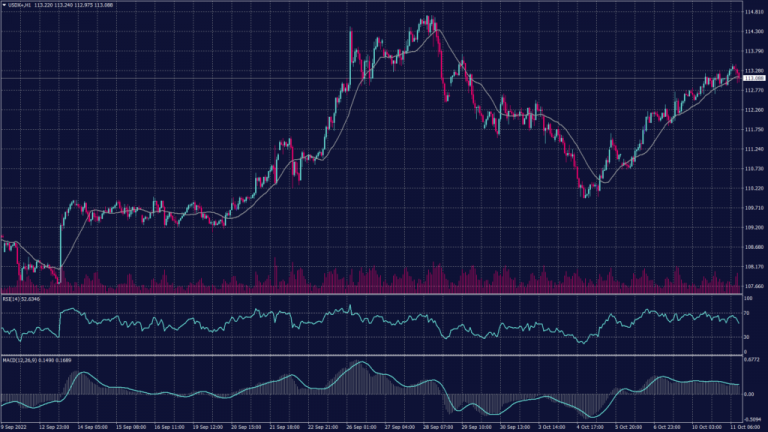
The index is trading at the resistance level 113.25 which may cause high level of volatility. However, there will be two scenarios at this level. The first one, if the index broke above 113.25 it will probably head towards 114 and 114.30. on the other hand, if the index failed to penetrate the resistance, it might head towards 112 on the short run. However, the daily chart remains positive as long as the index is trading above 109.60.
Pivot Point: 113.25

STERLING POUND (GBPUSD)

The Bank of England said it would widen its purchases of Gilts to include index-linked bonds, after a disorderly selloff in the asset class on Monday which appeared to be triggered – again – by pension funds raising cash to meet margin calls on longer-dated interest rate swaps.
On the other hand, Britain’s unemployment rate fell to its lowest since 1974 at 3.5% in the three months to August, but the drop was driven by a record jump in the number of people leaving the labor market, adding to the Bank of England’s headaches.
The number of people classed as inactive – neither in work nor looking for it – rose by 252,000 from the three months to May, the biggest such increase since records began in 1971, the Office for National Statistics said. However, the pound was down 0.4% against the dollar at $1.1013, having initially broken through the $1.10 level.
Technically:
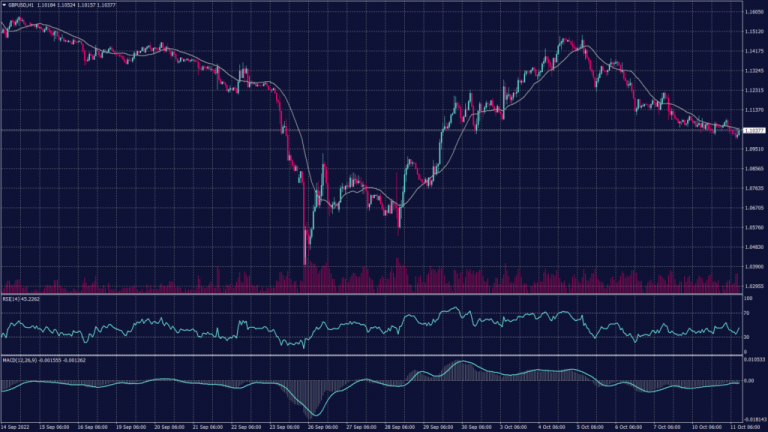
The cable is moving in a long negative channel on the hourly chart despite the support at 1.1000 level as the selling pressure remains strong. Meanwhile, the daily chart shows three consecutive lower tops and waiting for the confirmation of the third bottom below 1.0650. in terms of trading trend, the hourly chart indicates a continuation of the downtrend with no specific target but there will be fluctuations between 1.0950 and 1.1070.
Pivot Point: 1.1065

SPOT GOLD (XAUUSD)

Gold prices hovered above annual lows on Tuesday after tumbling sharply on hawkish signals from the Federal Reserve, while copper prices rose on hopes that Chinese demand will persevere despite recent economic headwinds.
Spot gold rose 0.1% to $1,669.76 an ounce, while gold futures gained 0.1% to $1,676.75 an ounce. Both instruments slumped nearly 2% on Monday, their worst drop in over two weeks.
Technically:
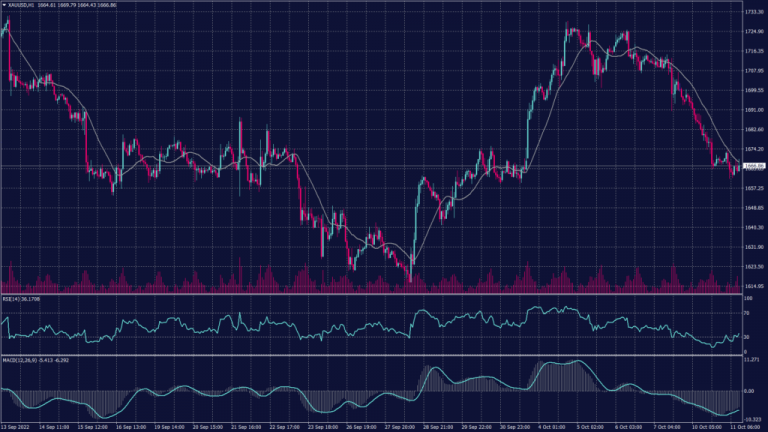
Gold prices are heading downwards on the hourly chart reaching the support at $1,665 per ounce. However, the current support is not strong enough to hold against the current selling pressure which might break the supports at 1,665 and 1,659 to head towards 1,650.
Meanwhile, the daily chart remains within the downtrend channel heading towards 1,620 on the foreseen time frame.
Pivot Point: 1,665

WEST TEXAS CRUDE (USOUSD)

Oil prices saw choppy trade on Tuesday as markets weighed potentially weaker demand against supply disruptions from the Russia-Ukraine conflict and OPEC production cuts. Fears of slowing demand in China also weighed, as the country reported fresh COVID outbreaks that could result in more lockdown measures. China is the world’s largest crude importer and has seen a severe drop in demand due to COVID-related restrictions this year.
London-traded Brent oil futures, the global benchmark, were flat at $96.19 a barrel, while U.S. West Texas Intermediate futures fell 0.1% to $91.06 a barrel. Both contracts slumped around 2% on Monday after hawkish comments from Federal Reserve Vice Chair Lael Brainard drove up concerns over a potential economic slowdown stemming from rising interest rates, which could dent crude demand.
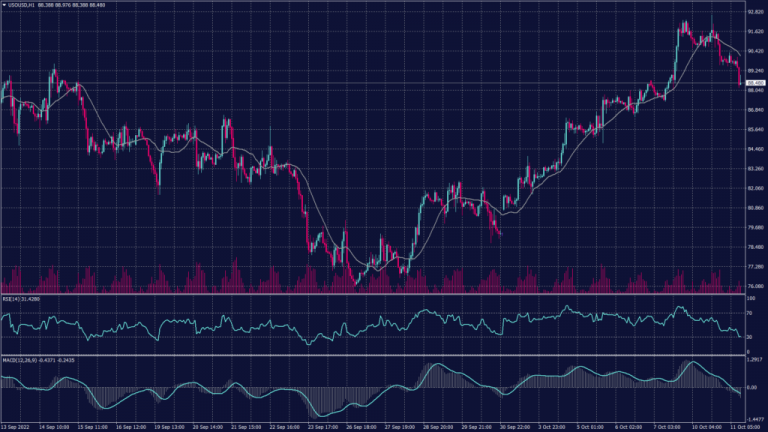
Pivot Point: 87.80
