Mar 2nd Daily Analysis

Mar 2nd Daily Analysis

BOEING COMPANY

In contrast to yesterday, when defense stocks of all stripes moved in only one direction — up — Russia’s continuing attack on Ukraine had divergent effects on defense stocks today. Boeing (NYSE: BA), maker of F-15 Strike Eagles fighter jets for the Air Force and F-18 Super Hornets for the Navy, saw its stock plunge 5.1%

Technical analysis:
From the overview of price on the higher timeframe, we could see that price has been ranging between two major zones. Within the major zones, we could see price retested a minor resistance level in conjunction with the 50 EMA and heading down to the major resistance level between 189.46 and 186.46 and may likely reverse to the upside once it gets to the oversold RSI level.

Alibaba Group Holding Ltd

The Alibaba Group Holding Ltd. ADR BABA, +1.81% rose 1.81% to $107.09 Tuesday, on what proved to be an all-around dismal trading session for the stock market, with the NASDAQ Composite Index COMP, -1.59% falling 1.59% to 13,532.46.
Alibaba Group Holding Ltd. ADR closed $138.60 short of its 52-week high ($245.69), which the company achieved on April 13th.

Technical analysis:
The overall trend for alibaba stock is bearish. We could clearly see that price is below the 50 EMA and has broken and retesting the resistance zone between 112.03 and 110.26.The RSI and MACD are below the centreline for a possible price continuation to the downside.

AMAZON Inc .

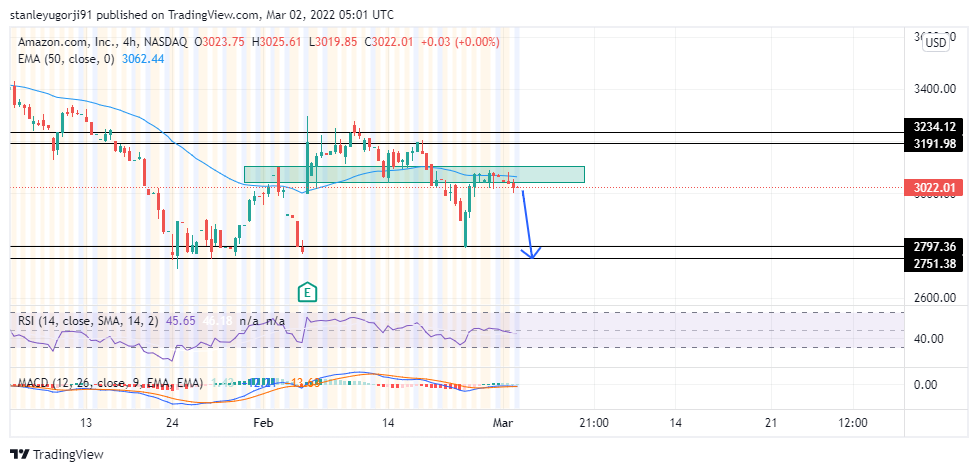
Shares of Amazon Inc. AMZN, -1.58% slipped 1.58% to $3,022.84 Tuesday, on what proved to be an all-around rough trading session for the stock market, with the S&P 500 Index SPX, -1.55% falling 1.55% to 4,306.26. This was the stock’s second consecutive day of losses. Amazon Inc. closed $750.24 short of its 52-week high ($3,773.08), which the company reached on July 13th.

Technical analysis:
The overall trend for price is bearish. We could see that price is currently retesting the minor resistance zone between 3105 and 3043 which also tested the 50 EMA before pushing to the downside. We could see from the RSI and MACD indicator that price is below the centreline for price continuation to the downside.

現在就與交易大師開始你的交易旅程!