June 14th Daily Analysis
June 14th Daily Analysis

U.S. DOLLAR INDEX (USDX)
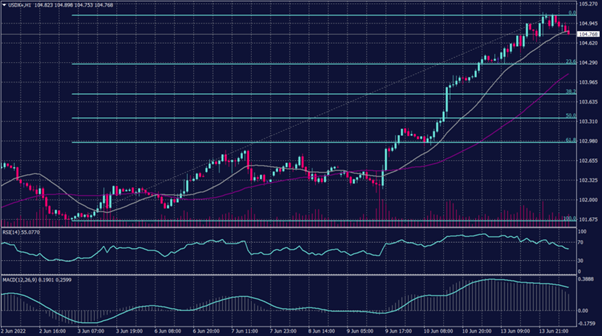
The U.S. dollar carried a fresh 20-year peak on Tuesday as investors braced for aggressive Federal Reserve rate hikes and a possible recession. In the meantime, markets have sped to bet on rapid hikes to face the unexpectedly sizzling inflation reading on Friday.
However, consecutive 75 basis point rate rises in June and July are close to fully priced, sending shockwaves across asset classes. The dollar has gained with yields and as investors seek shelter from the storm. The dollar index scaled a two-decade peak of 105.29 on Monday and held at that level in Asia.
Technically:
The U.S. Dollar index hit the resistance at 105.13 to record the highest level in 20 years before retreating to 104.60 this morning. On the hourly chart, Fibonacci retracement shows a solid resistance at 105.10 and indicates a retreat towards 104.30-104.35. However, technical indicators on the hourly chart show more decline during the day.
On the daily chart, 20 and 55 periods moving averages indicate further advancement and support above 102.30 for the longer time frames. However, RSI signals a correction decline while the MACD shows a possibility of reaching new highs above 105.60.
PIVOT POINT: 104.60

EURO (EURUSD)
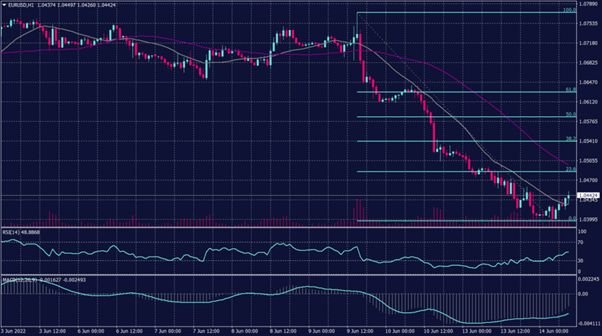
The European Central Bank (ECB) affirmed that it intends to start its rate hiking cycle in July and suggested that another increase in September will depend on the inflation data over the summer.
Meanwhile, German consumer prices rose 0.9% in May, after a gain of 0.8% the previous month. However, the annual figure climbed to 7.9%, from 7.4% in April, suggesting that the ECB has its work cut out controlling inflation in the Eurozone’s largest economy.
Other data due for release Tuesday includes Eurozone industrial production data for April and Germany’s ZEW index of economic sentiment for June.
Technically:
The EURUSD remains aggressively bearish on both intraday time frames and long-term charts. However, the hourly chart shows a slight corrective movement intraday but remains inside the declining channel. Also, the hourly chart is not showing support below the bottom at 1.0400 until 1.0360.
The Daily time frame shows resistance at 1.0400 but confirms the readings from the shorter time frames. However, the price trend is targeting the lowest since 2002 near 1.0300.
PIVOT POINT: 1.0400

STERLING POUND (GBPUSD)
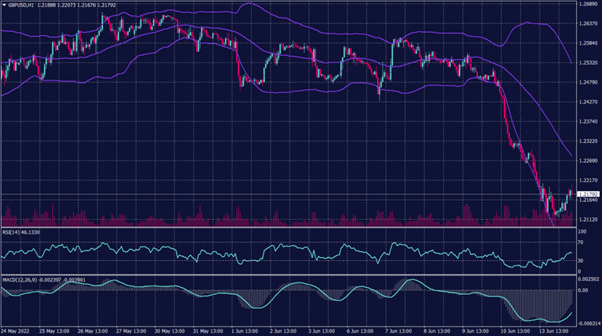
The yen fell to a fresh 20-year low against the dollar during the early trades, as U.S. inflation data pushed up Treasury yields, diminishing the earlier boost from speculation that Japanese authorities could intervene to support the currency. Central banks’ efforts to raise interest rates to curtail inflation will remain in focus this week, while no change is expected from the Bank of Japan.
The yen briefly rallied late on Friday when Japan’s government and the central bank said they were concerned by its recent sharp falls, the news was seen as an unexpected warning that Tokyo could intervene to support the currency.
Technically:
USDJPY pair has reached a fresh 20-year high at 135.19 during the early trades amid huge yen selling activities. The hourly chart shows resistance at the current levels, but the moving averages indicate further advance and support above 134.00.
Technical indicators on the hourly chart show a slight retreat towards 134.35, while it shows a strong advance possibility on the daily chart.
PIVOT POINT: 134.60

JAPANESE YEN (USDJPY)
The BOJ increased bond-purchase operations to keep yields in check. Meanwhile, the yen dipped near a 24-year low against the greenback.
The Bank of Japan (BOJ) will hand down its policy decisions on Friday. As the yen fell to 24-year lows to the dollar, Japanese Finance Minister Shunichi Suzuki reiterated on Tuesday the government will coordinate with the BOJ.
Technically:
USDJPY pair has reached a fresh 20-year high at 135.19 during the early trades amid huge yen selling activities. The hourly chart shows resistance at the current levels, but the moving averages indicate further advance and support above 134.00.
Technical indicators on the hourly chart show a slight retreat towards 134.35, while it shows a strong advance possibility on the daily chart.
PIVOT POINT: 134.60

SPOT GOLD (XAUUSD)
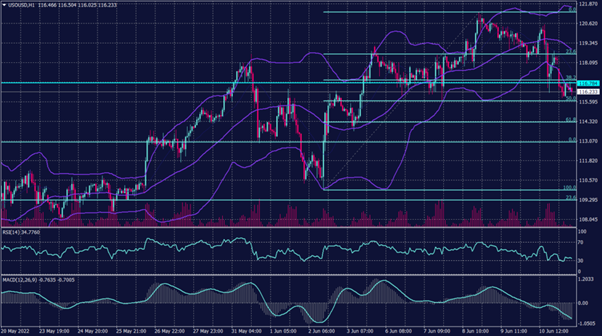
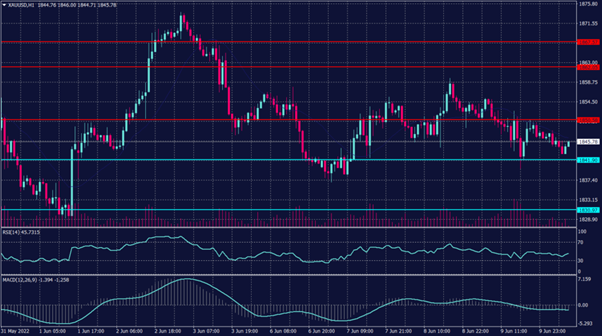
Gold was down on Tuesday morning in Asia and traded near a four-week low. Meanwhile, Wall Street officially entered a bear market as investors are worried about a recession caused by more aggressive interest rate hikes from the U.S. Federal Reserve.
Experts forecast a 75-basis point (bp) interest rate hike in the June policy meeting on Wednesday, which would be the biggest since 1994.
Technically:
The yellow metal declined below the support of $1,830 touching the previous target at $1,810 per ounce before bouncing back towards $1,825. The hourly chart shows that $1,830 is now resistance and will push the precious metal below $1,810.
Meanwhile, the daily chart shows a possibility that gold will hover above $1,810 under heavy selling pressure. However, technical indicators and volume measures indicate a further decline on the daily chart targeting $1,790 per ounce.
PIVOT POINT: 1,830
